Page 757 - Insurance Statistics 2021
P. 757

Indian Non-life Insurance Industry
                                                                                                                                                                                                                      Yearbook 2018-19


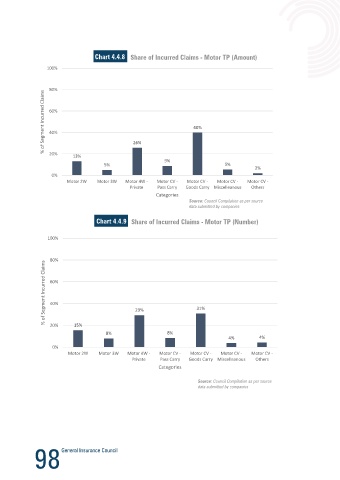
                                  Chart 4.4.8  Share of Incurred Claims - Motor TP (Amount)                                              Health & Accident
                 100%
                                                                                                                                         The Health & Personal Accident Insurance segment has grown at a CAGR of 20.7% over the period 2009-10 to 2018-19.
                                                                                                                                         Health Insurance comprises of 89.3% of the segment. Health & Personal Accident has crossed the 50,000 Cr mark for
                                                                                                                                         the first time over.
                  80%                                                                                                                                      Table 4.5.1   Health & Accident
                % of Segment Incurred Claims  60%                    40%                                                                                    2018-19                        Value


                  40%
                                                                                                                                                            No. Of Policies
                                                                                                                                                                                             4,82,14,140
                                                                                                                                                            Premium (in Cr)
                  20%
                                                                                                                                                                                              1,80,90,239
                           13%                  26%                                                                                                         No. Of Claims Reported          50,928
                                                           9%
                                      5%                                        5%                                                                          No. Of Paid Claims
                                                                                          2%                                                                                                  1,65,72,616
                   0%                                                                                                                                       Amt of Paid Claims (in Cr)        38,015
                        Motor 2W   Motor 3W  Motor 4W -  Motor CV -  Motor CV -  Motor CV -  Motor CV -
                                               Private  Pass Carry  Goods Carry Miscelleanous  Others                                                       Amt of Paid Claims (in Cr)      16,730
                                                        Categories                                                                                                                  Premium booked in India considered
                                                                   Source: Council Compilation as per source
                                                                   data submitted by companies

                                   Chart 4.4.9  Share of Incurred Claims - Motor TP (Number)                                                               Chart 4.5.1 GDPI - Health & Accident


                  100%                                                                                                                    60,000
                                                                                                                                                                                                                         51,213
                                                                                                                                          50,000
                   80%                                                                                                                    40,000                                                         34,774   42,334     5,479
                 % of Segment Incurred Claims  60%  29%               31%                                                               ₹ in Crores   30,000     14,822   17,292   19,677   22,726   27,568   3,706   37,875   45,734
                                                                                                                                                                                                                     4,460


                                                                                                                                                                                                     2,667
                   40%
                                                                                                                                                                                             2,216
                                                                                                                                          20,000
                                                                                                                                                                                     1,878
                                                                                                                                                             1,221
                   20%
                           15%
                                                                                                                                                            11,462
                                                                                                                                                    8,389  1,029
                                      8%                    8%                                                                            10,000  9,418   12,682    13,417   1,405   15,621   1,672   17,799   20,509   24,901   31,068
                                                                                 4%         4%
                                                                                                                                             -
                   0%
                         Motor 2W   Motor 3W  Motor 4W -  Motor CV -  Motor CV -  Motor CV -  Motor CV -
                                               Private   Pass Carry  Goods Carry Miscelleanous  Others
                                                         Categories                                                                                                                   Year
                                                                                                                                                                          Health  Personal Accident
                                                                      Source: Council Compilation as per source
                                                                      data submitted by companies

                                                                                                                                                                                                Source: Council Compilation as per source
                                                                                                                                                                                                data submitted by companies


             98                                                                                                                                                                                                             99
   752   753   754   755   756   757   758   759   760   761   762