Page 753 - Insurance Statistics 2021
P. 753

Indian Non-life Insurance Industry
                                                                                                                                                                                                                      Yearbook 2018-19


             Motor Third Party                                                                                                                         Chart 4.4.2 Gross & Net Incurred Claims  Ratio - Motor Third Party

                                                                                                                                          250.0%
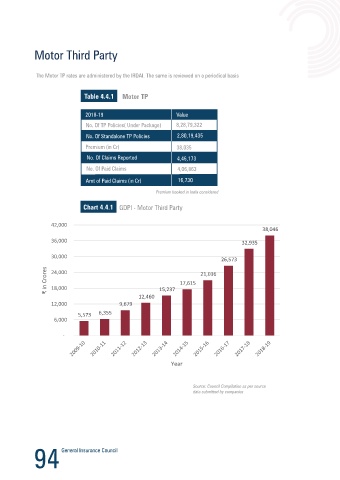
              The Motor TP rates are administered by the IRDAI. The same is reviewed on a periodical basis
                                                                                                                                          230.0%
                                                                                                                                                                  206.1%
                                                                                                                                          210.0%
                               Table 4.4.1  Motor TP
                                                                                                                                          190.0%
                                                                                                                                         %                172.8%
                                                                                                                                         Loss Ratio -      166.7%
                               2018-19                         Value                                                                      170.0%                  153.6%
                               No. Of TP Policies( Under Package)    8,28,79,322                                                          150.0%                          135.1%
                               No. Of Standalone TP Policies     2,80,19,435                                                              130.0%  123.6%
                                                                                                                                                                                 114.6%
                                                                                                                                                                                                       103.6%         104.2%
                               Premium (in Cr)                 38,035                                                                     110.0%   120.2%                                96.8%  93.0%          98.0%
                                                                                                                                                                                110.4%
                               No. Of Claims Reported            4,46,173                                                                  90.0%                         109.7%
                                                                                                                                                                                         98.9%          94.2%  96.5%
                               No. Of Paid Claims              4,06,863                                                                    70.0%                                                87.7%                  87.2%

                               Amt of Paid Claims (in Cr)      16,730

                                                        Premium booked in India considered
                                                                                                                                                                                     Year
                              Chart 4.4.1 GDPI - Motor Third Party                                                                                         Gross Incurred Claims Ratio   Net Incurred Claims Ratio

                                                                                                                                                                                            Source: Council Compilation as per source
                    42,000                                                                                                                                                                  data submitted by companies
                                                                                             38,046
                    36,000                                                            32,935                                                           Chart 4.4.3 Rural vs Urban Premium - Motor TP


                    30,000
                                                                                                                                                                                              Rural Premium
                                                                              26,573                                                                                                          Rural Premium
                                                                                                                                                                                              10.3%
                                                                                                                                                                                              10.3%
                 ₹ in Crores   18,000                           17,615   21,036
                    24,000
                                                  12,460   15,237
                    12,000                 9,679
                            5,573   6,355
                     6,000


                        -


                                                             Year


                                                                     Source: Council Compilation as per source
                                                                     data submitted by companies


                                                                                                                                                         Urban Premium
                                                                                                                                                         Urban Premium
                                                                                                                                                         89.7%
                                                                                                                                                         89.7%                              Source: Council Compilation as per source
                                                                                                                                                                                            data submitted by companies


             94                                                                                                                                                                                                             95
   748   749   750   751   752   753   754   755   756   757   758