
Page 749 - Insurance Statistics 2021
P. 749
Indian Non-life Insurance Industry
Yearbook 2018-19
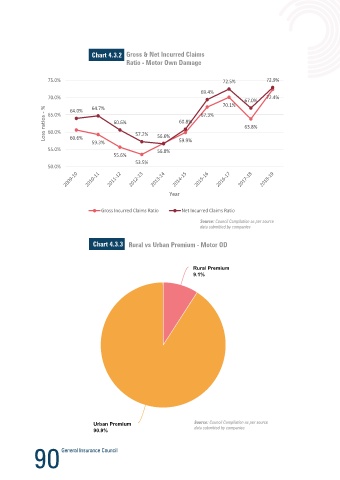
Chart 4.3.2 Gross & Net Incurred Claims Chart 4.3.4 Channelwise GDPI - Motor OD
Ratio - Motor Own Damage
Others
75.0% 72.5% 72.9% Others
9.6%
9.6%
69.4%
70.0% 72.4% Direct Business- Other
Direct Business- Other
than internet
70.1% 67.0% than internet
% 65.0% 64.0% 64.7% 67.3% 4.0% Individual Agents
4.0%
Individual Agents
Loss ratios - 60.0% 60.6% 57.2% 60.8% 63.8% Direct Business- Int…
29.7%
29.7%
Direct Business- Int…
1.2%
1.2%
60.6%
Arrange…
Referral
59.3% 56.6% 59.9% Referral Arrange…
0.0%
0.0%
55.0% 56.8%
55.6%
53.5%
50.0%
Corporate Agents-…
Corporate Agents-…
3.6%
3.6%
Year
Brokers
Brokers Corporate Agents- Others
Corporate Agents- Others
Gross Incurred Claims Ratio Net Incurred Claims Ratio 44.1% 7.9%
44.1%
7.9%
Source: Council Compilation as per source
data submitted by companies
Source: Council Compilation as per source
data submitted by companies
Chart 4.3.3 Rural vs Urban Premium - Motor OD
Chart 4.3.5 GDPI Breakup on Categories - Motor OD
100%
Rural Premium
Rural Premium
9.1%
9.1%
80%
% of Segment Premium 60% 49%
40%
20% 23%
13%
8%
2% 4% 1%
0%
Motor 2W Motor 3W Motor 4W - Motor CV - Motor CV - Motor CV - Motor CV -
Private Pass Carry Goods Carry Miscelleanous Others
Categories
Source: Council Compilation as per source
Urban Premium
Urban Premium Source: Council Compilation as per source data submitted by companies
data submitted by companies
90.9%
90.9%
90 91