
Page 752 - Insurance Statistics 2021
P. 752
Indian Non-life Insurance Industry
Yearbook 2018-19
Chart 4.3.6 Policies Breakup on Categories - Motor OD
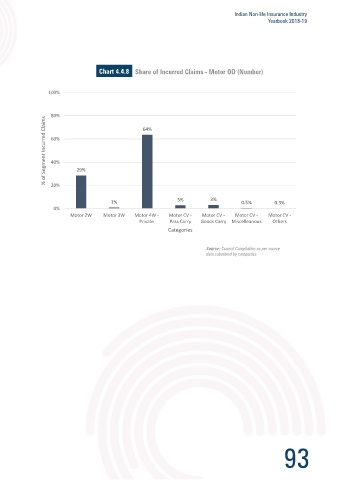
Chart 4.4.8 Share of Incurred Claims - Motor OD (Number)
100%
100%
80%
80%
% of Segment Policies 60% % of Segment Incurred Claims 60% 64%
59%
40%
20% 26% 40% 29%
6%
2% 3% 3% 0% 20%
0%
Motor 2W Motor 3W Motor 4W - Motor CV - Motor CV - Motor CV - Motor CV - 3% 3%
Private Pass Carry Goods Carry Miscelleanous Others 1% 0.5% 0.3%
0%
Categories
Motor 2W Motor 3W Motor 4W - Motor CV - Motor CV - Motor CV - Motor CV -
Source: Council Compilation as per source Private Pass Carry Goods Carry Miscelleanous Others
data submitted by companies
Categories
Chart 4.3.7 Share of Incurred Claims - Motor OD (Amount)
Source: Council Compilation as per source
data submitted by companies
100%
80% 66%
% of Segment Incurred Claims 60%
40%
20%
10% 16%
5%
1% 2% 0.3%
0%
Motor 2W Motor 3W Motor 4W - Motor CV - Motor CV - Motor CV - Motor CV -
Private Pass Carry Goods Carry Miscelleanous Others
Categories
Source: Council Compilation as per source
data submitted by companies
92 93