
Page 755 - Insurance Statistics 2021
P. 755
Indian Non-life Insurance Industry
Yearbook 2018-19
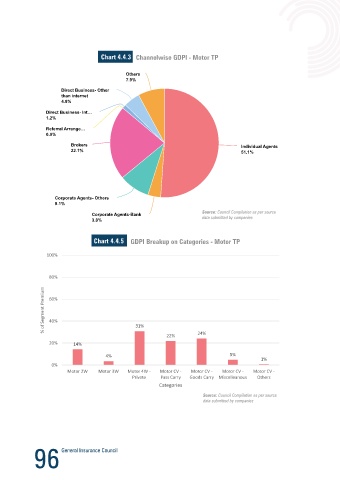
Chart 4.4.3 Channelwise GDPI - Motor TP Chart 4.4.6 Policies Breakup on Categories - Motor TP
100%
Others
Others
7.9%
7.9%
Direct Business- Other 80%
Direct Business- Other
than internet
than internet
% of Segment Policies
4.8%
4.8%
Direct Business- Int… 60% 56%
Direct Business- Int…
1.2%
1.2%
Referral
Referral Arrange… 40%
Arrange…
0.0% 28%
0.0%
Brokers
Brokers Individual Agents
Individual Agents
22.1%
22.1% 51.1% 20%
51.1%
3% 3% 5% 4% 1%
0%
Motor 2W Motor 3W Motor 4W - Motor CV - Motor CV - Motor CV - Motor CV -
Private Pass Carry Goods Carry Miscelleanous Others
Categories
Corporate Agents- Others
Corporate Agents- Others
9.1% Source: Council Compilation as per source
9.1%
data submitted by companies
Source: Council Compilation as per source
Corporate
Corporate Agents-Bank
Agents-Bank
3.8%
3.8% data submitted by companies Chart 4.4.7 Motor Third Party Claims
20,00,000
Chart 4.4.5 GDPI Breakup on Categories - Motor TP 18,58,454
18,00,000
100% 16,73,452
15,77,693
15,56,285
Number of Claims 14,00,000 14,40,922 13,15,936
16,00,000
15,19,036
80% 14,59,736 15,87,602
% of Segment Premium 60% 10,00,000 11,87,904
12,00,000
40%
31%
22% 24% 8,00,000
20% 14%
4% 5% Year Number of Claims
1%
0% Caveat: The data/ratio represents only the Incurred Claims of Motor TP Insurance portfolio as a percentage of TP
Motor 2W Motor 3W Motor 4W - Motor CV - Motor CV - Motor CV - Motor CV - Premium accounted during the Financial years. Motor TP portfolio is long tail in nature. TP Liability Claim pertaining to
Private Pass Carry Goods Carry Miscelleanous Others TP policies issued during a Financial year gets reported 4-5 years after the expiry of the Financial Year.
Categories
Source: Form no VI of Forms I-X for the year 2013-2014 onwards and IIB summary Reports for earlier years. Gross
Source: Council Compilation as per source
data submitted by companies Incurred Claims from Council Compilation
Note: Lag in claims reporting and subsequent payment of claims in a year is characteristic of Motor TP Policies, hence
the above chart may be viewed with such understanding.
Source: Council Compilation as per source
data submitted by companies
96 97