
Page 761 - Insurance Statistics 2021
P. 761
Indian Non-life Insurance Industry
Yearbook 2018-19
Property (Fire + Engineering)
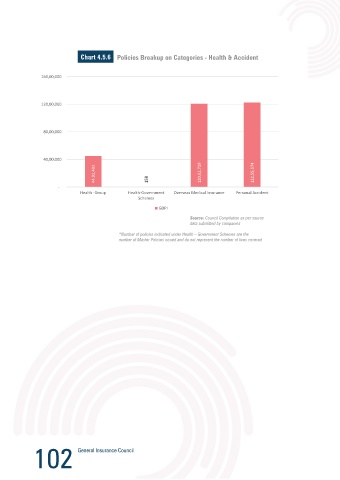
Chart 4.5.6 Policies Breakup on Categories - Health & Accident
Property insurance business comprises fire and engineering segments. This class of business was de-tariffed on
160,00,000
1st April, 2007.
Property insurance business has registered a CAGR of 11% over the period 2009-10 to 2018-19. Proportion of Engineering
business has increased over the last year, which is a change of trend as it had showed a decrease in the prior years.
120,00,000
Table 4.6.1 Property
2018-19 Value
80,00,000
No. Of Policies 73,79,772
Premium (in Cr) 14,135
40,00,000 No. Of Claims Reported 1,52,753
44,92,402 158 120,62,729 122,55,574 No. Of Paid Claims 1,27,894
- Amt of Paid Claims (in Cr) 6,930
Health -Group Health-Government Overseas Medical Insurance Personal Accident Amt of Paid Claims (in Cr) 16,730
Schemes Premium booked in India considered
GDPI
Source: Council Compilation as per source
data submitted by companies Chart 4.6.1 GDPI - Property Insurance
*Number of policies indicated under Health – Government Schemes are the
number of Master Policies issued and do not represent the number of lives covered 16,000 15,054
13,813
12,743
12,134 2,542
11,396 2,287
12,000 10,793
9,867 2,458 2,469 2,387
₹ in Crores 8,000 5,886 6,847 8,251 2,559 2,611 12,512
2,352
1,699 1,956 8,938 9,665 10,357 11,527
4,000 7,309 8,182
4,187 4,890 5,899
-
Year
Fire Engineering
Source: Council Compilation as per source
data submitted by companies
102 103