Page 790 - Insurance Statistics 2021
P. 790

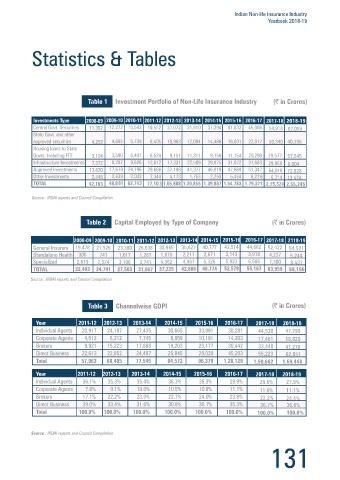
Indian Non-life Insurance Industry
                                                                                               Yearbook 2018-19


                                                                                              2017-18 2018-19
                                                                                               54,918  62,059
                                                                                               30,340  40,236


                                                                                               29,577  57,545
                                                                                               29,958  9,004
                                                                                                64,016  72,928
                                                                                                6,714  13,474
                                                                                              2,15,524  2,55,245

            Source : IRDAI reports and Council Compilation


                           2008-09 2009-10 2010-11 2011-12 2012-13 2013-14 2014-15 2015-16 2016-17 2017-18 2118-19
             General Insurers   19,478  21,526  23,380  26,638  30,985  35,627  40,777  43,514  44,662  52,422    54,521
             Standalone Health  306  741   1,017  1,287  1,878   2,211  2,671   3,143   3,918  4,237   5,244
             Specialized    2,619  2,524   3,106  3,741  4,362   4,967  5,326   5,923   6,586  7,300   8,431
             TOTAL         22,403  24,791  27,503  31,667  37,225  42,806  48,774  52,579  55,167  63,959  68,196

            Source : IRDAI reports and Council Compilation


                                                                                           2017-18  2018-19
                                                                                            44,538   47,299
                                                                                           17,461    18,820
                                                                                            33,440   41,278
                                                                                           55,223    62,051
                                                                                          1,50,662  1,69,448

                                                                                           2017-18  2018-19
                                                                                            29.6%    27.9%
                                                                                            11.6%    11.1%
 Table 14: Gross Underwriting Experience
                                                                                            22.2%    24.4%
     - 2007-08 To 2018-19 (Overall Figures)                                                 36.7%    36.6%
 Table 15: Net Underwriting Experience                                                     100.0%    100.0%
     - 2007-08 To 2018-19 (Overall Figures)
            Source : IRDAI reports and Council Compilation


 130                                                                                            131
   785   786   787   788   789   790   791   792   793   794   795