
Page 785 - Insurance Statistics 2021
P. 785
Indian Non-life Insurance Industry
Yearbook 2018-19
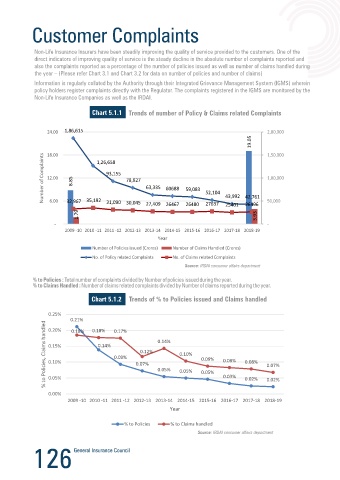
Non-Life Insurance Insurers have been steadily improving the quality of service provided to the customers. One of the
direct indicators of improving quality of service is the steady decline in the absolute number of complaints reported and
also the complaints reported as a percentage of the number of policies issued as well as number of claims handled during Chart 5.2.1
the year – (Please refer Chart 3.1 and Chart 3.2 for data on number of policies and number of claims)
Information is regularly collated by the Authority through their Integrated Grievance Management System (IGMS) wherein 100000
policy holders register complaints directly with the Regulator. The complaints registered in the IGMS are monitored by the 85187
Non-Life Insurance Companies as well as the IRDAI. 80000
Chart 5.1.1 Trends of number of Policy & Claims related Complaints 60000 58498
Number of Complaints Reported 58807 42982
24.00 1,86,615 2,00,000 40000 35793
19.05 42621 45132 28100 25633 26838 26937 25516 25369
18.00 1,26,658 1,50,000 20000 23028 34836 30279 23677 24647 24536 18904 13227 11809
Number of Complaints 12.00 8.85 93,155 78,927 63,335 60688 59,083 52,104 1,00,000 0 2009-10 2010-11 2011-12 2012-13 2013-14 2014-15 2015-16 2016-17 2017-18 2018-19
15337
12855
11558
6263
5583
5252
7709
10408
Year
43,992 42,761
32,967 35,192
6.00
31,090 30,045
27637
26480
27,409 26467
26496
25401
50,000 Motor Health Others
1.79
3.93
- - The number and type of complaints received in Health insurance during the year 2018-19 are as follows:
2009 -10 2010 -11 2011 -12 2012-13 2013-14 2014-15 2015-16 2016-17 2017-18 2018-19
Year
Chart 5.2.2 Health Insurance
Number of Policies issued (Crores) Number of Claims Handled (Crores)
Complaints (2018-19)
No. of Policy related Complaints No. of Claims related Complaints
Proposal related
Proposal related
Others 0.8%
Others
0.8%
13.1%
13.1%
Coverage related
Coverage related
0.8%
0.8%
Chart 5.1.2 Trends of % to Policies issued and Claims handled Policy related
Policy related
14.0%
14.0%
0.25% 0.21% 0.18% 0.17% Premium related
Premium related
% to Policies, Claims handled 0.15% 0.14% 0.09% 0.07% 0.14% 0.10% 0.09% 0.08% 0.08% 0.07% Refund
3.9%
3.9%
0.20%
0.18%
Product related
Product related
0.9%
0.9%
0.12%
Refund
0.10%
2.4%
2.4%
0.05%
0.05%
0.05%
0.05%
0.00% 0.03% 0.02% 0.02%
2009 -10 2010 -11 2011 -12 2012-13 2013-14 2014-15 2015-16 2016-17 2017-18 2018-19
Year
Claim related
Claim related
% to Policies % to Claims handled
64.2%
64.2%
126 127