
Page 14 - Food Outlook
P. 14
MILK AND MILK PRODUCTS
World milk production is set to reach 833.5 million tonnes in 2017, 1.4 percent more than in 2016. Much of the anticipated rise is expected in Asia and the Americas, while the sector might stagnate in Europe and Africa and possibly face a decline in Oceania.
World trade in dairy products is forecast to increase
by 1.3 percent in 2017 to 71.6 million tonnes (in milk equivalent) marking a second year of modest growth.
Most of the export growth is expected to come from
North America and Europe. Despite a slow growth in milk production, the EU is anticipated to account for the largest export expansion, underpinned by increased sales of cheese and skim milk powder (SMP). Likewise, greater shipments of cheese, but also of SMP, are expected to boost exports from the United States. In contrast, exports from South America, Oceania, Asia and Africa are forecast to decline in 2017, largely reflecting supply constraints.
On the demand side, Asia is anticipated to drive
the expansion, with imports by the region predicted at around 41 million tonnes, 1.5 percent more than in 2016. Within Asia, China is behind much of that expected increase, with its purchases fuelled by demand for higher value-added dairy products, in particular cheese and
SMP. Elsewhere, imports are forecast to rise in Algeria, Australia, the Russian Federation, Mexico, Indonesia, the Republic of Korea, Japan, Thailand and Pakistan. Conversely, imports are foreseen to decline significantly in Brazil, Saudi Arabia, Oman, the United States, the EU, the Philippines, Egypt, Malaysia, the United Arab Emirates, Cuba, Belarus and Turkey.
Among the various dairy products, world trade in cheese and SMP is expected to increase in 2017, while trade in butter and WMP may contract.
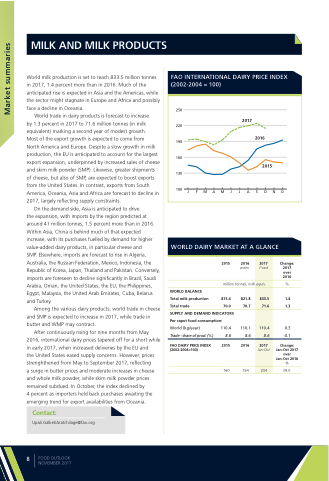
After continuously rising for nine months from May 2016, international dairy prices tapered off for a short while in early 2017, when increased deliveries by the EU and
the United States eased supply concerns. However, prices strenghthened from May to September 2017, reflecting
a surge in butter prices and moderate increases in cheese and whole milk powder, while skim milk powder prices remained subdued. In October, the index declined by
4 percent as importers held back purchases awaiting the emerging trend for export availabilities from Oceania.
Contact:
Upali.GalketiAratchilage@fao.org
FAO INTERNATIONAL DAIRY PRICE INDEX (2002-2004 = 100)
250 220 190 160 130
2017
2016
2015
100 J F M A M J J A S O N D
WORLD DAIRY MARKET AT A GLANCE
2017
f’cast
equiv.
833.5 71.6
110.4
8.6
2017
Jan-Oct
204
2015
2016
estim.
Change: 2017 over 2016
%
1.4 1.3
0.3
-0.1
Change: Jan-Oct 2017 over Jan-Oct 2016 %
39.0
million tonnes, milk
WORLD BALANCE
Total milk production 815.4 Total trade 70.0
SUPPLY AND DEMAND INDICATORS Per caput food consumption:
821.8 70.7
World (kg/year)
Trade - share of prod. (%)
FAO DAIRY PRICE INDEX (2002-2004=100)
110.4 110.1
8.6 8.6
2015 2016
160 154
8
FOOD OUTLOOK NOVEMBER 2017
Market summaries
