
Page 15 - Food Outlook
P. 15
FISH AND FISHERY PRODUCTS
Global production of fish and fishery products is expected to expand by 2.3 percent in 2017, a faster growth rate than last year, primarily accounted for by a recovery in catches
of anchoveta in South America and by a further expansion of aquaculture production, which continues to rise at some 4–5 percent a year. The aquaculture sector is estimated to be the world’s primary source of fish for all purposes within 5 years.
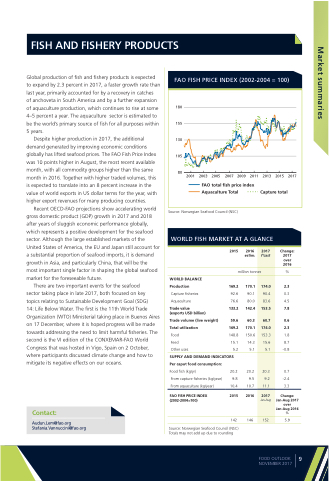
Despite higher production in 2017, the additional demand generated by improving economic conditions globally has lifted seafood prices. The FAO Fish Price Index was 10 points higher in August, the most recent available month, with all commodity groups higher than the same month in 2016. Together with higher traded volumes, this is expected to translate into an 8 percent increase in the value of world exports in US dollar terms for the year, with higher export revenues for many producing countries.
Recent OECD-FAO projections show accelerating world gross domestic product (GDP) growth in 2017 and 2018 after years of sluggish economic performance globally, which represents a positive development for the seafood sector. Although the large established markets of the United States of America, the EU and Japan still account for a substantial proportion of seafood imports, it is demand growth in Asia, and particularly China, that will be the most important single factor in shaping the global seafood market for the foreseeable future.
There are two important events for the seafood
sector taking place in late 2017, both focused on key topics relating to Sustainable Development Goal (SDG)
14: Life Below Water. The first is the 11th World Trade Organization (WTO) Ministerial taking place in Buenos Aires on 17 December, where it is hoped progress will be made towards addressing the need to limit harmful fisheries. The second is the VI edition of the CONXEMAR-FAO World Congress that was hosted in Vigo, Spain on 2 October, where participants discussed climate change and how to mitigate its negative effects on our oceans.
Contact:
Audun.Lem@fao.org Stefania.Vannuccini@fao.org
FAO FISH PRICE INDEX (2002-2004 = 100)
180 155 130 105
80
2001 2003 2005 2007 2009 2011 2013 2015 2017
FAO total fish price index
Aquaculture Total Capture total
Source: Norwegian Seafood Council (NSC)
WORLD FISH MARKET AT A GLANCE
2015
2016
estim.
Change: 2017 over 2016
%
2.3
0.3 4.5 7.8
0.6 2.3 1.8 8.7
-0.8
0.7 -2.4 3.3
Change: Jan-Aug 2017 over Jan-Aug 2016 %
5.9
million tonnes
WORLD BALANCE
Production 169.2
170.1
90.1
80.0
142.4
60.3 170.1 150.6
14.3 5.1
20.2 9.5 10.7
2016
146
Capture fisheries
Aquaculture
Trade value
(exports USD billion)
Trade volume (live weight) Total utilization
Food
Feed Other uses
92.6
76.6
133.2
59.6 169.2 148.8
15.1 5.2
SUPPLY AND DEMAND INDICATORS Per caput food consumption:
Food fish (kg/yr)
From capture fisheries (kg/year) From aquaculture (kg/year)
FAO FISH PRICE INDEX (2002-2004=100)
20.2 9.8 10.4
2015
142
Source: Norwegian Seafood Council (NSC) Totals may not add up due to rounding
2017
f’cast
174.0
90.4
83.6
153.5
60.7 174.0 153.3
15.6 5.1
20.3 9.2 11.1
2017
Jan-Aug
152
FOOD OUTLOOK NOVEMBER 2017
9
Market summaries
