
Page 22 - Food Outlook
P. 22
In Europe, aggregate wheat imports in 2017/18 are forecast to reach 7.7 million tonnes, up 460 000 tonnes from the 2016/17 estimate, with most of the increase
in the EU. Total wheat imports by the EU are forecast at
5.3 million tonnes, slightly higher than in 2016/17, despite this year’s sharp recovery in production. Strong demand for durum wheat is the main reason behind the expectation for higher imports.
In North America, tight domestic supplies of premium wheat in the United States are likely to drive up imports to 4.1 million tonnes, 800 000 tonnes more than in 2016/17 and the highest level since 2013/14.
Regarding exports, overall supplies of wheat in 2017/18 should be more than adequate to meet the global import demand. Aggregate wheat exports by the major exporting countries3 in 2017/18 (July/June) are forecast to amount to just under 162 million tonnes, some 1.5 million tonnes less than in 2016/17.
Among the major exporters, competition for markets
is expected to remain stiff, as has been the case over the past few seasons. Large supplies from the Black Sea region, in particular from the Russian Federation following this year’s bumper crop, are expected to further intensify this competition for market shares. Wheat shipments from
the Russian Federation are forecast to increase to at least 32 million tonnes, 17 percent above the 2016/17 level and an all-time high, which places the country as the world’s largest wheat exporter. The increase in exports from the Russian Federation will more than offset reduced sales by Ukraine and Kazakhstan, the other two regional players.
Exports from the EU are also set to increase, by around 9 percent to just over 28 million tonnes. This year’s strong recovery in production and more favourable exchange
rate are seen to boost sales from the EU, although the overall shipments would remain well below the record
34 million tonnes attained in 2014/15. While Canada
is seen to export 21 million tonnes of wheat, slightly
more than last season, wheat sales by Argentina are pegged at 12 million tonnes, nearly unchanged from the previous year’s high level. By contrast, shipments from the United States are forecast to fall, by almost 11 percent, to around 26 million tonnes. Reduced domestic production and a stronger US dollar are expected to weigh on sales
by the United States this season, although demand for the United States’ high protein wheat is expected to continue unabated (see Box 2).
3 Major exporters of wheat include Argentina, Australia, Canada, EU, Kazakhstan, Russian Fed., Ukraine and the United States.
UTILIZATION
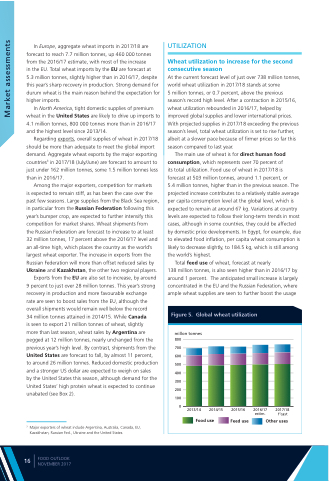
Wheat utilization to increase for the second consecutive season
At the current forecast level of just over 738 million tonnes, world wheat utilization in 2017/18 stands at some
5 million tonnes, or 0.7 percent, above the previous season’s record high level. After a contraction in 2015/16, wheat utilization rebounded in 2016/17, helped by improved global supplies and lower international prices. With projected supplies in 2017/18 exceeding the previous season’s level, total wheat utilization is set to rise further, albeit at a slower pace because of firmer prices so far this season compared to last year.
The main use of wheat is for direct human food consumption, which represents over 70 percent of
its total utilization. Food use of wheat in 2017/18 is forecast at 503 million tonnes, around 1.1 percent, or
5.4 million tonnes, higher than in the previous season. The projected increase contributes to a relatively stable average per capita consumption level at the global level, which is expected to remain at around 67 kg. Variations at country levels are expected to follow their long-term trends in most cases, although in some countries, they could be affected by domestic price developments. In Egypt, for example, due to elevated food inflation, per capita wheat consumption is likely to decrease slightly, to 184.5 kg, which is still among the world’s highest.
Total feed use of wheat, forecast at nearly
138 million tonnes, is also seen higher than in 2016/17 by around 1 percent. The anticipated small increase is largely concentrated in the EU and the Russian Federation, where ample wheat supplies are seen to further boost the usage
Figure 5. Global wheat utilization
millon tonnes
800 700 600 500 400 300 200 100
0
2013/14 2014/15
Food use
2015/16
Feed use
2016/17 estim.
2017/18 f’cast
Other uses
16
FOOD OUTLOOK NOVEMBER 2017
Market assessments
