
Page 28 - Food Outlook
P. 28
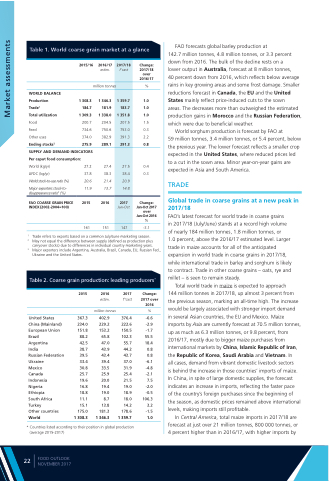
   Table 1. World coarse grain market at a glance
2015/16 2016/17 Change: estim. 2017/18
FAO forecasts global barley production at
142.7 million tonnes, 4.8 million tonnes, or 3.3 percent down from 2016. The bulk of the decline rests on a
lower output in Australia, forecast at 8 million tonnes,
40 percent down from 2016, which reflects below average rains in key growing areas and some frost damage. Smaller reductions forecast in Canada, the EU and the United States mainly reflect price-induced cuts to the sown
areas. The decreases more than outweighed the estimated production gains in Morocco and the Russian Federation, which were due to beneficial weather.
World sorghum production is forecast by FAO at
59 million tonnes, 3.4 million tonnes, or 5.4 percent, below the previous year. The lower forecast reflects a smaller crop expected in the United States, where reduced prices led to a cut in the sown area. Minor year-on-year gains are expected in Asia and South America.
TRADE
Global trade in coarse grains at a new peak in 2017/18
FAO’s latest forecast for world trade in coarse grains
in 2017/18 (July/June) stands at a record high volume
of nearly 184 million tonnes, 1.8 million tonnes, or
1.0 percent, above the 2016/17 estimated level. Larger trade in maize accounts for all of the anticipated expansion in world trade in coarse grains in 2017/18, while international trade in barley and sorghum is likely to contract. Trade in other coarse grains – oats, rye and millet – is seen to remain steady.
Total world trade in maize is expected to approach
144 million tonnes in 2017/18, up almost 3 percent from the previous season, marking an all-time high. The increase would be largely associated with stronger import demand in several Asian countries, the EU and Mexico. Maize imports by Asia are currently forecast at 70.5 million tonnes, up as much as 6.3 million tonnes, or 9.8 percent, from 2016/17, mostly due to bigger maize purchases from international markets by China, Islamic Republic of Iran, the Republic of Korea, Saudi Arabia and Vietnam. In
all cases, demand from vibrant domestic livestock sectors
is behind the increase in those countries’ imports of maize. In China, in spite of large domestic supplies, the forecast indicates an increase in imports, reflecting the faster pace
of the country’s foreign purchases since the beginning of the season, as domestic prices remained above international levels, making imports still profitable.
In Central America, total maize imports in 2017/18 are forecast at just over 21 million tonnes, 800 000 tonnes, or 4 percent higher than in 2016/17, with higher imports by
     WORLD BALANCE
Production
Trade1 184.7 Total utilization 1 309.3 Food 200.7 Feed 734.6 Other uses 374.0 Ending stocks2 275.9
SUPPLY AND DEMAND INDICATORS Per caput food consumption:
million tonnes
1 346.3 181.9 1 338.0 204.5 750.6 382.9 289.1
over 2016/17
%
1.0 1.0 1.0 1.5 0.3 2.2 0.8
0.4 0.3
Change: Jan-Oct 2017 over Jan-Oct 2016 %
-3.1
1 308.3
  World (kg/yr)
LIFDC (kg/yr)
World stock-to-use ratio (%)
Major exporters stock-to- disappearance ratio3 (%)
FAO COARSE GRAIN PRICE INDEX (2002-2004=100)
27.2 27.4 37.8 38.3 20.6 21.4 11.9 13.7
2015 2016
161 151
        1 Trade refers to exports based on a common July/June marketing season.
2 May not equal the difference between supply (defined as production plus carryover stocks) due to differences in individual country marketing years.
3 Major exporters include Argentina, Australia, Brazil, Canada, EU, Russian Fed., Ukraine and the United States.
Table 2. Coarse grain production: leading producers*
  2015
367.3 234.0 151.8
88.2 42.5 38.7 39.5 33.4 30.8 25.7 19.6 16.8 18.8 11.1 15.1
175.0
1 308.3
2016 2017
estim. f”cast
Change: 2017 over 2016
%
-6.6 -2.9 -1.7 55.5 18.4
0.8
0.8 -6.1 -4.8 -2.1
7.5 -2.0 -0.5
106.3 3.2 -1.5 1.0
  United States China (Mainland) European Union Brazil
Argentina
India
Russian Federation Ukraine
Mexico
Canada
Indonesia
Nigeria
Ethiopia
South Africa Turkey
Other countries World
million tonnes
402.9 229.2 153.2
65.8 47.0 43.9 43.4 39.4 33.5 25.9 20.0 19.4 19.0
8.7 13.8 181.3 1 346.3
376.4 222.6 150.5 102.3
55.7 44.2 43.7 37.0 31.9 25.4 21.5 19.0 18.9 18.0 14.2
178.6
1 359.7
 * Countries listed according to their position in global production (average 2015-2017)
2017/18
f’cast
  1 359.7 183.7 1 351.8 207.5 753.0 391.3 291.3
 27.5 38.4 20.9 14.8
  2017
Jan-Oct
 147
      22
FOOD OUTLOOK NOVEMBER 2017
Market assessments
