
Page 3 - BE Theory Note
P. 3
Breakeven Graph
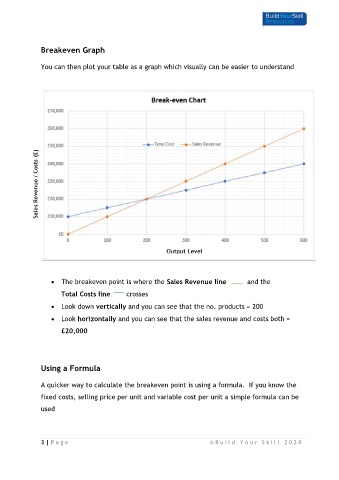
You can then plot your table as a graph which visually can be easier to understand
• The breakeven point is where the Sales Revenue line and the
Total Costs line crosses
• Look down vertically and you can see that the no. products = 200
• Look horizontally and you can see that the sales revenue and costs both =
£20,000
Using a Formula
A quicker way to calculate the breakeven point is using a formula. If you know the
fixed costs, selling price per unit and variable cost per unit a simple formula can be
used
3 | P a g e © B u i l d Y o u r S k i l l 2 0 2 0