
Page 6 - BE Theory Note
P. 6
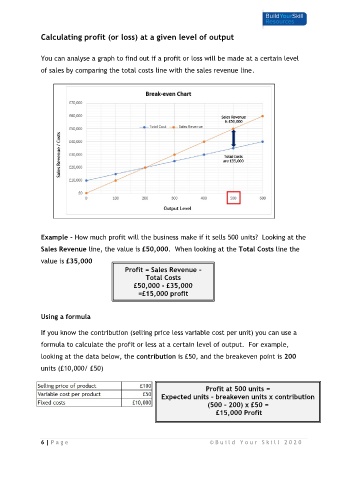
Calculating profit (or loss) at a given level of output


               You can analyse a graph to find out if a profit or loss will be made at a certain level
               of sales by comparing the total costs line with the sales revenue line.


               Example – How much profit will the business make if it sells 500 units?  Looking at the

               Sales Revenue line, the value is £50,000.  When looking at the Total Costs line the
               value is £35,000

                                             Profit = Sales Revenue –
                                                    Total Costs
                                                £50,000 - £35,000
                                                  =£15,000 profit


               Using a formula

               If you know the contribution (selling price less variable cost per unit) you can use a

               formula to calculate the profit or less at a certain level of output.  For example,
               looking at the data below, the contribution is £50, and the breakeven point is 200

               units (£10,000/ £50)


                                                                         Profit at 500 units =
                                                          Expected units – breakeven units x contribution
                                                                          (500 – 200) x £50 =
                                                                             £15,000 Profit


               6 | P a g e                                                 © B u i l d   Y o u r   S k i l l   2 0 2 0