
Page 56 - CAREPOINT GLOBAL BUSINESS PLAN
P. 56
Appendix
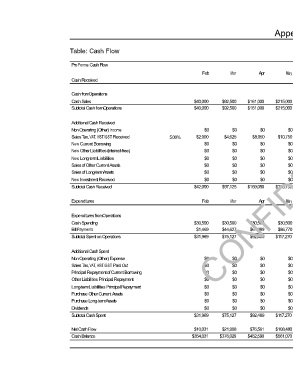
Table: Cash Flow
P ro Forma Cash Flow
Feb Mar Apr May Jun Jul Aug Sep Oct Nov Dec Jan
Cash Received
Cash fromOperations
Cash Sales $40,000 $92,500 $161,000 $215,000 $260,000 $315,000 $372,000 $450,000 $562,000 $732,500 $815,000 $923,684
Subtotal Cash fromOperations $40,000 $92,500 $161,000 $215,000 $260,000 $315,000 $372,000 $450,000 $562,000 $732,500 $815,000 $923,684
Additional Cash Received
Non Operating (Other) Income $0 $0 $0 $0 $0 $0 $0 $0 $0 $0 $0 $0
Sales Tax, VAT, HST/GST Received 5.00% $2,000 $4,625 $8,050 $10,750 $13,000 $15,750 $18,600 $22,500 $28,100 $36,625 $40,750 $46,184
New Current Borrowing $0 $0 $0 $0 $0 $0 $0 $0 $0 $0 $0 $0
New Other Liabilities (interest-free) $0 $0 $0 $0 $0 $0 $0 $0 $0 $0 $0 $0
New Long-termLiabilities $0 $0 $0 $0 $0 $0 $0 $0 $0 $0 $0 $0
Sales of Other Current Assets $0 $0 $0 $0 $0 $0 $0 $0 $0 $0 $0 $0
Sales of Long-termAssets $0 $0 $0 $0 $0 $0 $0 $0 $0 $0 $0 $0
New Investment Received $0 $0 $0 $0 $0 $0 $0 $0 $0 $0 $0 $0
$390,600
$330,750
$97,125
$169,050
Subtotal Cash Received $42,000 CONFIDENTIAL $472,500 $590,100 $769,125 $855,750 $969,868
$273,000
$225,750
Expenditures Feb Mar Apr May Jun Jul Aug Sep Oct Nov Dec Jan
Expenditures fromOperations
Cash Spending $30,500 $30,500 $30,500 $30,500 $30,500 $30,500 $30,500 $30,500 $30,500 $30,500 $30,500 $30,500
Bill Payments $1,469 $44,627 $61,989 $86,770 $107,869 $121,899 $144,696 $165,750 $192,613 $228,194 $276,996 $300,896
Subtotal Spent on Operations $31,969 $75,127 $92,489 $117,270 $138,369 $152,399 $175,196 $196,250 $223,113 $258,694 $307,496 $331,396
Additional Cash Spent
Non Operating (Other) Expense $0 $0 $0 $0 $0 $10,500 $10,500 $10,500 $10,500 $10,500 $10,500 $10,500
Sales Tax, VAT, HST/GST Paid Out $0 $0 $0 $0 $0 $0 $0 $0 $0 $0 $0 $0
Principal Repayment of Current Borrowing $0 $0 $0 $0 $0 $0 $0 $0 $0 $0 $0 $0
Other Liabilities Principal Repayment $0 $0 $0 $0 $0 $0 $0 $0 $0 $0 $0 $0
Long-termLiabilities Principal Repayment $0 $0 $0 $0 $0 $0 $0 $0 $0 $0 $0 $0
Purchase Other Current Assets $0 $0 $0 $0 $0 $0 $0 $0 $0 $0 $0 $0
Purchase Long-termAssets $0 $0 $0 $0 $0 $0 $0 $0 $0 $0 $0 $0
Dividends $0 $0 $0 $0 $0 $0 $0 $0 $0 $0 $0 $0
Subtotal Cash Spent $31,969 $75,127 $92,489 $117,270 $138,369 $162,899 $185,696 $206,750 $233,613 $269,194 $317,996 $341,896
Net Cash Flow $10,031 $21,998 $76,561 $108,480 $134,631 $167,851 $204,904 $265,750 $356,487 $499,931 $537,754 $627,972
Cash Balance $354,031 $376,029 $452,590 $561,070 $695,701 $863,552 $1,068,456 $1,334,206 $1,690,692 $2,190,623 $2,728,378 $3,356,350
Page 5
CarePoint Global Business Plan +966 55 119 6445