Page 33 - Shareholders Report 2021
P. 33

DELIVERY GROUPS  |  CORPORATE SUPPORT  |  FINANCIAL STATEMENTS


                                                                                                                                      FINANCIAL STATEMENTS


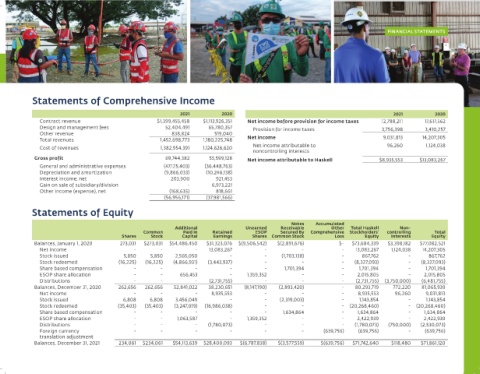
              Statements of Comprehensive Income


                                                                2021          2020                                                      2021          2020
                 Contract revenue                        $1,399,455,458    $1,113,926,351   Net income before provision for income taxes   12,788,211    17,617,562
                 Design and management fees                 52,404,491    65,780,357     Provision for income taxes                  3,756,398      3,410,257
                 Other revenue                                838,824       519,040
                 Total revenues                           1,452,698,773    1,180,225,748   Net income                                9,031,813     14,207,305
                 Cost of revenues                         1,382,954,391    1,124,626,620   Net income attributable to                  96,260       1,124,038
                                                                                         noncontrolling interests
               Gross profit                                 69,744,382     55,599,128   Net income attributable to Haskell          $8,935,553    $13,083,267
                 General and administrative expenses       (47,125,403)   (36,448,763)
                 Depreciation and amortization             (9,866,033)    (10,246,138)
                 Interest income, net                         203,900        921,453
                 Gain on sale of subsidiary/division               -        6,973,221
                 Other income (expense), net                 (168,635)       818,661
                                                           (56,956,171)   (37,981,566)

              Statements of Equity

                                                                                                      Notes   Accumulated
                                                               Additional             Unearned    Receivable       Other  Total Haskell   Non-
                                                    Common       Paid in   Retained       ESOP    Secured By  Comprehensive   Stockholders'  controlling  Total
                                             Shares   Stock      Capital   Earnings      Shares  Common Stock       Loss       Equity  Interests     Equity
               Balances, January 1, 2020    273,031  $273,031  $54,486,450  $31,323,076  $(9,506,542)  $(2,891,676)   $-  $73,684,339  $3,398,182  $77,082,521
                 Net income                      -        -          -    13,083,267         -           -             -   13,083,267  1,124,038  14,207,305
                 Stock issued                5,850    5,850    2,565,050         -           -    (1,703,138)          -      867,762        -      867,762
                 Stock redeemed            (16,225)  (16,225)  (4,866,931)  (3,443,937)      -           -             -   (8,327,093)       -    (8,327,093)
                 Share based compensation        -        -          -           -           -     1,701,394           -     1,701,394       -     1,701,394
                 ESOP share allocation           -        -     656,453          -     1,359,352         -             -    2,015,805        -     2,015,805
                 Distributions                   -        -          -    (2,731,755)        -           -             -    (2,731,755)  (3,750,000)  (6,481,755)
               Balances, December 31, 2020  262,656  262,656  52,841,022  38,230,651  (8,147,190)  (2,893,420)         -   80,293,719   772,220   81,065,939
                 Net income                      -        -          -     8,935,553         -           -             -    8,935,553    96,260    9,031,813
                 Stock issued                6,808    6,808    3,456,049         -           -    (2,319,003)          -     1,143,854       -     1,143,854
                 Stock redeemed            (35,403)  (35,403)  (3,247,019)  (16,986,038)     -           -             -  (20,268,460)       -  (20,268,460)
                 Share based compensation        -        -          -           -           -     1,634,864           -    1,634,864        -     1,634,864
                 ESOP share allocation           -        -    1,063,587         -     1,359,352         -             -    2,422,939        -     2,422,939
                 Distributions                   -        -          -    (1,780,073)        -           -             -   (1,780,073)  (750,000)  (2,530,073)
                 Foreign currency                -        -          -           -           -           -       (639,756)  (639,756)        -     (639,756)
                 translation adjustment
               Balances, December 31, 2021  234,061  $234,061  $54,113,639  $28,400,093  $(6,787,838)  $(3,577,559)  $(639,756)  $71,742,640  $118,480  $71,861,120
   28   29   30   31   32   33   34   35   36