Page 34 - Shareholders Report 2021
P. 34

DELIVERY GROUPS  |  CORPORATE SUPPORT  |  FINANCIAL STATEMENTS


                                  S
                                  S
                                 T
                     I
                                 T
                           T
                              EN
                    C
                            EM
                           T
                            EM
                     I
                         T
                         S
                         T
                          A
                          A
                         S
                      A
                      A
                              EN
                       L
                       L
                IN
               F F
               FINANCIAL STATEMENTS
                  A
                  A
                IN
                   N
                    C
                   N
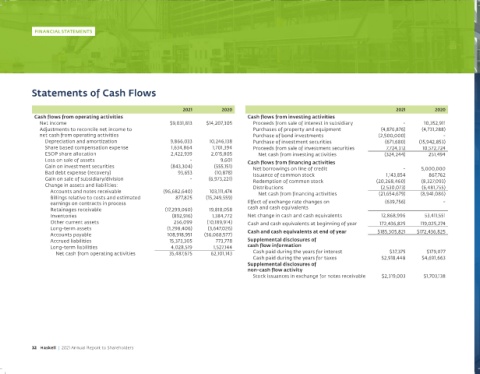
              Statements of Cash Flows
                                                                 2021         2020                                                       2021         2020
               Cash flows from operating activities                                    Cash flows from investing activities
                 Net income                                  $9,031,813    $14,207,305   Proceeds from sale of interest in subsidiary       -      10,352,911
                 Adjustments to reconcile net income to                                  Purchases of property and equipment         (4,876,876)   (4,731,288)
                 net cash from operating activities                                      Purchase of bond investments               (2,500,000)           -
                   Depreciation and amortization             9,866,033     10,246,138    Purchase of investment securities            (671,680)   (15,942,853)
                   Share based compensation expense           1,634,864     1,701,394    Proceeds from sale of investment securities   7,724,312    10,572,724
                   ESOP share allocation                      2,422,939    2,015,805       Net cash from investing activities         (324,244)      251,494
                   Loss on sale of assets                           -         9,601    Cash flows from financing activities
                   Gain on investment securities              (843,304)     (555,151)    Net borrowings on line of credit                   -     5,000,000
                   Bad debt expense (recovery)                  93,653      (10,878)     Issuance of common stock                     1,143,854      867,762
                   Gain on sale of subsidiary/division              -     (6,973,221)    Redemption of common stock                (20,268,460)   (8,327,093)
                   Change in assets and liabilities:                                     Distributions                              (2,530,073)   (6,481,755)
                    Accounts and notes receivable          (96,682,640)    103,111,474     Net cash from financing activities       (21,654,679)   (8,941,086)
                    Billings relative to costs and estimated    877,825    (15,249,559)
                    earnings on contracts in process                                   Effect of exchange rate changes on             (639,756)           -
                    Retainages receivable                   (17,299,060)   19,818,058   cash and cash equivalents
                    Inventories                               (892,916)     1,384,772   Net change in cash and cash equivalents      12,868,996    53,411,551
                    Other current assets                       256,099    (10,189,914)  Cash and cash equivalents at beginning of year   172,436,825    119,025,274
                    Long-term assets                        (1,298,406)   (3,647,026)  Cash and cash equivalents at end of year    $185,305,821    $172,436,825
                    Accounts payable                        108,918,951    (56,068,577)
                    Accrued liabilities                      15,373,305      773,778   Supplemental disclosures of
                    Long-term liabilities                     4,028,519     1,527,144   cash flow information
                      Net cash from operating activities     35,487,675    62,101,143    Cash paid during the years for interest       $37,375      $179,077
                                                                                         Cash paid during the years for taxes        $2,918,448    $4,691,663
                                                                                       Supplemental disclosures of
                                                                                       non-cash flow activity
                                                                                         Stock issuances in exchange for notes receivable   $2,319,003    $1,703,138


              32   Haskell  |  2021 Annual Report to Shareholders
   29   30   31   32   33   34   35   36