
Page 329 - Ranah Studi Agraria: Penguasaan Tanah dan Hubungan Agraris
P. 329
Ranah Studi Agraria
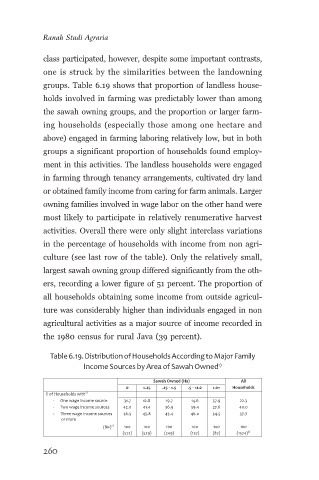
class participated, however, despite some important contrasts,
one is struck by the similarities between the landowning
groups. Table 6.19 shows that proportion of landless house-
holds involved in farming was predictably lower than among
the sawah owning groups, and the proportion or larger farm-
ing households (especially those among one hectare and
above) engaged in farming laboring relatively low, but in both
groups a significant proportion of households found employ-
ment in this activities. The landless households were engaged
in farming through tenancy arrangements, cultivated dry land
or obtained family income from caring for farm animals. Larger
owning families involved in wage labor on the other hand were
most likely to participate in relatively renumerative harvest
activities. Overall there were only slight interclass variations
in the percentage of households with income from non agri-
culture (see last row of the table). Only the relatively small,
largest sawah owning group differed significantly from the oth-
ers, recording a lower figure of 51 percent. The proportion of
all households obtaining some income from outside agricul-
ture was considerably higher than individuals engaged in non
agricultural activities as a major source of income recorded in
the 1980 census for rural Java (39 percent).
Table 6.19. Distribution of Households According to Major Family
Income Sources by Area of Sawah Owned 1)
Sawah Owned (Ha) All
0 <.25 .25 - <.5 .5 - <1.0 1.0+ Households
% of Households with 2)
- One wage income source 31.7 12.8 19.7 14.6 37.9 22.3
Two wage income sources 42.0 41.4 36.9 39.4 27.6 40.0
-
- Three wage income sources 26.3 45.8 43.4 46.0 24.5 37.7
or more
(N=) 2) 100 100 100 100 100 100
(572) (529) (249) (137) (87) (1574) 2)
260