
Page 63 - Visual Marketing
P. 63
Why It Works Success Metrics Takeaway Tip
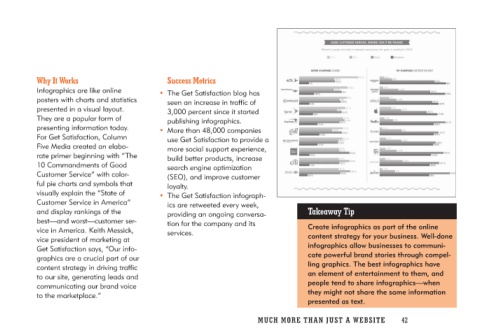
Infographics are like online • The Get Satisfaction blog has Create infographics as part of the online
posters with charts and statistics seen an increase in traffic of content strategy for your business. Well-done
presented in a visual layout. 3,000 percent since it started infographics allow businesses to communi-
They are a popular form of publishing infographics. cate powerful brand stories through compel-
presenting information today. ling graphics. The best infographics have
For Get Satisfaction, Column • More than 48,000 companies an element of entertainment to them, and
Five Media created an elabo- use Get Satisfaction to provide a people tend to share infographics—when
rate primer beginning with “The more social support experience, they might not share the same information
10 Commandments of Good build better products, increase presented as text.
Customer Service” with color- search engine optimization
ful pie charts and symbols that (SEO), and improve customer
visually explain the “State of loyalty.
Customer Service in America”
and display rankings of the • The Get Satisfaction infograph-
best—and worst—customer ser- ics are retweeted every week,
vice in America. Keith Messick, providing an ongoing conversa-
vice president of marketing at tion for the company and its
Get Satisfaction says, “Our info- services.
graphics are a crucial part of our
content strategy in driving traffic
to our site, generating leads and
communicating our brand voice
to the marketplace.”
MUCH MO RE THAN JUST A W E BS I TE 42