
Page 231 - Untitled-1
P. 231
210 COMPUTER-BASED APPROACHES TO RISK
met will be adversely affected by the number of paths that converge at a single
point. At least, this phenomenon is not taken into consideration in traditional
CPM calculations. But merge bias will have considerable impact on project end
date confidence.
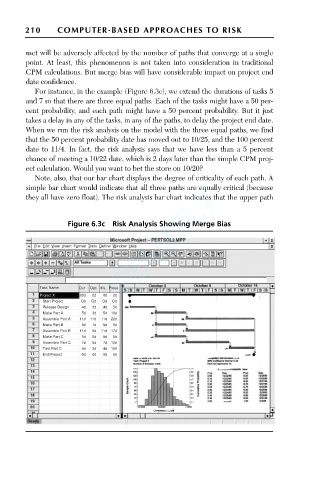
For instance, in the example (Figure 6.3c), we extend the durations of tasks 5
and 7 so that there are three equal paths. Each of the tasks might have a 50 per-
cent probability, and each path might have a 50 percent probability. But it just
takes a delay in any of the tasks, in any of the paths, to delay the project end date.
When we run the risk analysis on the model with the three equal paths, we find
that the 50 percent probability date has moved out to 10/25, and the 100 percent
date to 11/4. In fact, the risk analysis says that we have less than a 5 percent
chance of meeting a 10/22 date, which is 2 days later than the simple CPM proj-
ect calculation. Would you want to bet the store on 10/20?
Note, also, that our bar chart displays the degree of criticality of each path. A
simple bar chart would indicate that all three paths are equally critical (because
they all have zero float). The risk analysis bar chart indicates that the upper path
Figure 6.3c Risk Analysis Showing Merge Bias
TEAMFLY
Task Name Dur Opti ML Press
Project X 20d 0d 0d 0d
Start Project Od Od Od Od
Release Design 4d 3d 4d 5d
Make Part A 5d 3d 5d 10d
Assemble Part A 11d 11d 11d 22d
Make Part B 5d 1d 5d 5d
Assemble Part B 11d 5d 11d 17d
Make Part C 5d 5d 5d 5d
Assemble Part C 7d 5d 7d 12d
Test Part C 4d 3d 4d 10d
End Project 0d 0d 0d 0d