
Page 230 - Untitled-1
P. 230
USING RISK+ FOR MICROSOFT PROJECT 209
(triple) estimates, or can have the system spread the optimistic and pessimistic values
based on a set of user-defined preferences. Where Risk+ departs from the capabili-
ties of PS8 is in the ability to compute the probability of meeting any schedule date.
This program and Monte Carlo, our next example, do not try to average the three
time estimates (as in the prior example) but rather make several passes through the
network, using random selection of the (defined) possible task durations.
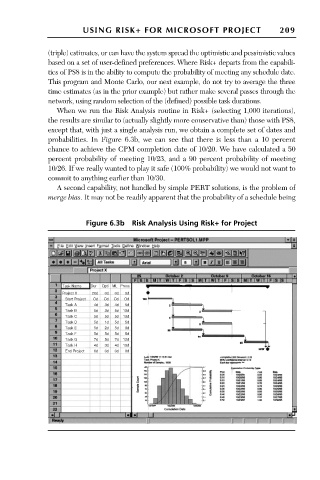
When we run the Risk Analysis routine in Risk+ (selecting 1,000 iterations),
the results are similar to (actually slightly more conservative than) those with PS8,
except that, with just a single analysis run, we obtain a complete set of dates and
probabilities. In Figure 6.3b, we can see that there is less than a 10 percent
chance to achieve the CPM completion date of 10/20. We have calculated a 50
percent probability of meeting 10/23, and a 90 percent probability of meeting
10/26. If we really wanted to play it safe (100% probability) we would not want to
commit to anything earlier than 10/30.
A second capability, not handled by simple PERT solutions, is the problem of
merge bias. It may not be readily apparent that the probability of a schedule being
Figure 6.3b Risk Analysis Using Risk+ for Project
Task Name Dur Opti ML Press
Project X 20d 0d 0d 0d
Start Project Od Od Od Od
Task A 4d 3d 4d 5d
Task B 5d 3d 5d 10d
Task C 5d 5d 5d 10d
Task D 5d 1d 5d 5d
Task E 5d 2d 5d 8d
Task F 5d 5d 5d 5d
Task G 7d 5d 7d 12d
Task H 4d 3d 4d 10d
End Project 0d 0d 0d 0d