
Page 229 - Untitled-1
P. 229
208 COMPUTER-BASED APPROACHES TO RISK
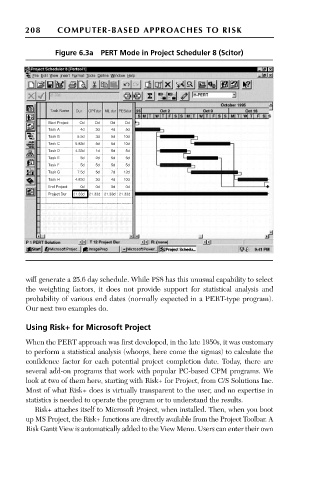
Figure 6.3a PERT Mode in Project Scheduler 8 (Scitor)
Task Name Dur OPTdur ML dur PESdur
Start Project Od Od Od Od
Task A 4d 3d 4d 5d
Task B 5.5d 3d 5d 10d
Task C 5.83d 5d 5d 10d
Task D 4.33d 1d 5d 5d
Task E 5d 2d 5d 5d
Task F 5d 5d 5d 5d
Task G 7.5d 5d 7d 12d
Task H 4.83d 3d 4d 10d
End Project 0d 0d 0d 0d
Project Dur 21.33d 21.33d 21.33d 21.33d
will generate a 25.6 day schedule. While PS8 has this unusual capability to select
the weighting factors, it does not provide support for statistical analysis and
probability of various end dates (normally expected in a PERT-type program).
Our next two examples do.
Using Risk+ for Microsoft Project
When the PERT approach was first developed, in the late 1950s, it was customary
to perform a statistical analysis (whoops, here come the sigmas) to calculate the
confidence factor for each potential project completion date. Today, there are
several add-on programs that work with popular PC-based CPM programs. We
look at two of them here, starting with Risk+ for Project, from C/S Solutions Inc.
Most of what Risk+ does is virtually transparent to the user, and no expertise in
statistics is needed to operate the program or to understand the results.
Risk+ attaches itself to Microsoft Project, when installed. Then, when you boot
up MS Project, the Risk+ functions are directly available from the Project Toolbar. A
Risk Gantt View is automatically added to the View Menu. Users can enter their own