
Page 90 - Minerva Foods Sustainability Report 2016
P. 90
2016 Sustainability Report
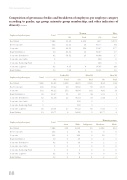
Composition of governance bodies and breakdown of employees per employee category according to gender, age group, minority group membership, and other indicators of diversity G4-LA12
Employees by job category
Beef Brasil
Beef Corporate
Total
7,386
102
Women
Men
Total
5,074
68
177
17
17
5
1
88
12
Over 50
Total
616
12
16
1
1
-
-
5
4
Corporate 331
(%)
31.30
33.33
46.53
43.33
59.52
-
-
4.35
7.69
Under 30
Total
3,209
40
153
11
22
-
-
27
4
Asian
219
1
1
0
0
0
0
0
0
Total
2,312
34
154
13
25
-
-
4
1
30 to 50
Total
3,561
50
162
18
19
5
1
60
5
Indigenous
10
0
0
0
0
0
0
0
0
(%)
68.7
66.77
53.47
56.67
40.48
100
100
95.65
92.31
(%)
8.34
11.76
4.83
3.33
2.38
-
-
5.43
30.77
Brazil Distribution
Corporate Distribution
Corporate Live Cattle
Corporate Rendering Plant
Corporate Logistics
Brazil Rubber
Employees by job category
Beef Brasil
Beef Corporate
Total
7,386
102
30
42
5
1
92
13
(%)
43.45
39.22
46.22
36.67
52.38
-
-
29.35
30.77
Total
7,386
102
(%)
48.21
49.02
48.94
60
45.24
100
100
65.22
38.46
White
2,639
92
304
25
39
5
1
74
8
Corporate 331
Brazil Distribution 30
Corporate Distribution 42
Corporate Live Cattle 5
Corporate Rendering Plant 1
Corporate Logistics 92
Brazil Rubber 13
Employees by job category
Beef Brasil
Beef Corporate
Minority groups
Mixed race Black
4,104 414
9 0
19 7
2 3
2 1
0 0
0 0
9 9
2 3
Corporate 331
Brazil Distribution
Corporate Distribution
Corporate Live Cattle
Corporate Rendering Plant
Corporate Logistics
Brazil Rubber
30
42
5
1
92
13
88
