Page 14 - Oxford West Investor Quarterly Report 1.25.22
P. 14

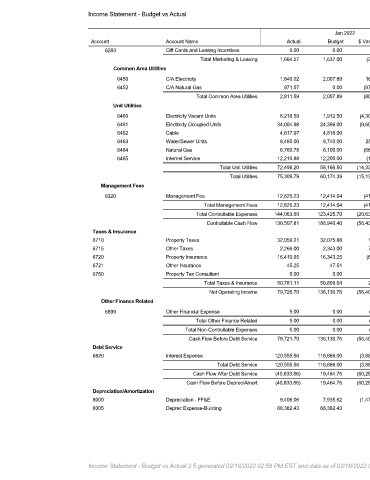
Income Statement - Budget vs Actual                                                                                                                                     Property:Oxford West


                                                                                                                Jan 2022                                          YTD ( Aug 2021 - Jan 2022 )
                               Account                  Account Name                            Actual       Budget     $ Variance    % Variance        Actual       Budget       $ Variance     % Variance  Annual Budget
                                    6283                Gift Cards and Leasing Incentives        0.00          0.00         0.00         0.00%       10,000.00     10,000.00          0.00           0.00%      10,000.00
                                                                   Total Marketing & Leasing  1,664.57      1,637.00      (27.57)        -1.68%      39,001.21     40,822.00       1,820.79          4.46%      66,044.00
                                      Common Area Utilities
                                        6450            C/A Electricity                       1,840.02      2,007.89      167.87         8.36%       10,316.11      8,133.99       (2,182.12)      -26.83%      20,175.36
                                        6452            C/A Natural Gas                        971.57          0.00      (971.57)      -100.00%        983.79          0.00         (983.79)      -100.00%          0.00
                                                                  Total Common Area Utilities  2,811.59     2,007.89     (803.70)       -40.03%      11,299.90      8,133.99       (3,165.91)      -38.92%      20,175.36
                                      Unit Utilities
                                        6460            Electricity Vacant Units              6,218.59      1,912.50    (4,306.09)     -225.16%      21,938.12     17,882.30       (4,055.82)      -22.68%      30,504.80
                                        6461            Electricity Occupied Units           34,004.98     24,396.00    (9,608.98)      -39.39%     113,093.95     97,506.00      (15,587.95)      -15.99%     198,041.00
                                        6462            Cable                                 4,817.97      4,818.00        0.03         0.00%       27,783.35     28,908.00       1,124.65          3.89%      57,816.00
                                        6463            Water/Sewer Units                     8,485.00      8,740.00      255.00         2.92%       73,385.21     68,263.00       (5,122.21)       -7.50%     138,589.00
                                        6464            Natural Gas                           6,760.78      6,100.00     (660.78)       -10.83%      20,072.86     21,450.00       1,377.14          6.42%      40,550.00
                                        6465            Internet Service                     12,210.88     12,200.00      (10.88)        -0.09%      64,981.39     73,200.00       8,218.61         11.23%     146,400.00
                                                                          Total Unit Utilities  72,498.20  58,166.50   (14,331.70)      -24.64%     321,254.88    307,209.30      (14,045.58)       -4.57%     611,900.80
                                                                             Total Utilities  75,309.79    60,174.39   (15,135.40)      -25.15%     332,554.78    315,343.29      (17,211.49)       -5.46%     632,076.16
                                  Management Fees
                                    6320                Management Fee                       12,825.23     12,414.64     (410.59)        -3.31%      71,320.27     69,797.73       (1,522.54)       -2.18%     140,817.15
                                                                    Total Management Fees    12,825.23     12,414.64     (410.59)        -3.31%      71,320.27     69,797.73       (1,522.54)       -2.18%     140,817.15
                                                                  Total Controllable Expenses  144,063.69  123,425.70  (20,637.99)      -16.72%     857,556.77    850,722.66       (6,834.11)       -0.80%    1,531,835.47
                                                                     Controllable Cash Flow  130,507.81   186,940.40   (56,432.59)      -30.19%     852,049.06    894,220.64      (42,171.58)       -4.72%    1,988,593.33
                                Taxes & Insurance
                                6710                    Property Taxes                       32,059.21     32,075.88       16.67         0.05%      192,355.26    192,455.28         100.02          0.05%     384,910.56
                                6715                    Other Taxes                           2,266.00      2,343.00       77.00         3.29%        4,385.00      4,686.00         301.00          6.42%       9,372.00
                                6720                    Property Insurance                   16,410.65     16,343.25      (67.40)        -0.41%      97,521.45     94,167.83       (3,353.62)       -3.56%     192,225.83
                                6721                    Other Insurance                         45.25         47.51         2.26         4.76%         271.50        285.06          13.56           4.76%        570.12
                                6750                    Property Tax Consultant                  0.00          0.00         0.00         0.00%           0.00          0.00           0.00           0.00%       1,025.00
                                                                     Total Taxes & Insurance  50,781.11    50,809.64       28.53         0.06%      294,533.21    291,594.17       (2,939.04)       -1.01%     588,103.51
                                                                      Net Operating Income   79,726.70    136,130.76   (56,404.06)      -41.43%     557,515.85    602,626.47      (45,110.62)       -7.49%    1,400,489.82
                                  Other Finance Related
                                    6899                Other Financial Expense                  5.00          0.00        (5.00)      -100.00%         15.00          0.00          (15.00)      -100.00%          0.00
                                                                  Total Other Finance Related    5.00          0.00        (5.00)      -100.00%         15.00          0.00          (15.00)      -100.00%          0.00
                                                              Total Non-Controllable Expenses    5.00          0.00        (5.00)      -100.00%         15.00          0.00          (15.00)      -100.00%          0.00
                                                               Cash Flow Before Debt Service  79,721.70   136,130.76   (56,409.06)      -41.44%     557,500.85    602,626.47      (45,125.62)       -7.49%    1,400,489.82
                                Debt Service
                                6820                    Interest Expense                    120,555.56    116,666.00    (3,889.56)       -3.33%     715,555.55    699,996.00      (15,559.55)       -2.22%    1,399,992.00
                                                                         Total Debt Service  120,555.56   116,666.00    (3,889.56)       -3.33%     715,555.55    699,996.00      (15,559.55)       -2.22%    1,399,992.00
                                                                 Cash Flow After Debt Service  (40,833.86)  19,464.76  (60,298.62)     -309.78%    (158,054.70)   (97,369.53)     (60,685.17)      -62.32%        497.82
                                                               Cash Flow Before Deprec/Amort  (40,833.86)  19,464.76   (60,298.62)     -309.78%    (158,054.70)   (97,369.53)     (60,685.17)      -62.32%        497.82
                                Depreciation/Amortization
                                8000                    Depreciation - FF&E                   9,406.06      7,935.62    (1,470.44)      -18.53%      55,385.39     47,613.72       (7,771.67)      -16.32%      95,227.44
                                8005                    Deprec Expense-Building              68,382.43     68,382.43        0.00         0.00%      410,294.58    410,294.58          0.00           0.00%     820,589.16


                              Income Statement - Budget vs Actual 2.5 generated 02/18/2022 02:58 PM EST and data as of 02/18/2022 02:58 PM EST                                                                 Page 4 of 5
   9   10   11   12   13   14   15   16   17   18   19