
Page 33 - Basic PD Theory
P. 33
PD Data Types
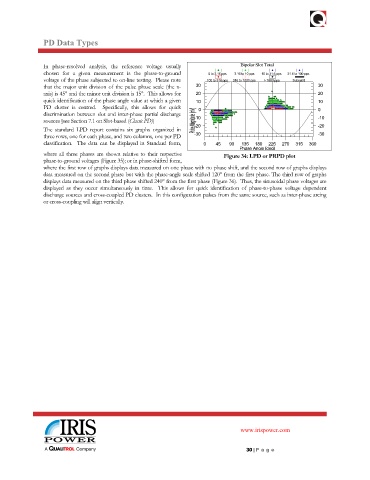
In phase-resolved analysis, the reference voltage usually Bipolar Slot Total
chosen for a given measurement is the phase-to-ground 0 to 3.16 pps 3.16 to 10 pps 10 to 31.6 pps 31.6 to 100 pps
voltage of the phase subjected to on-line testing. Please note 100 to 316 pps 316 to 1000 pps > 1000 pps Subset 8
that the major unit division of the pulse phase scale (the x- 30 30
axis) is 45° and the minor unit division is 15°. This allows for 20 20
quick identification of the phase angle value at which a given 10 10
PD cluster is centred. Specifically, this allows for quick 0 0
Pulse Magnitude [mV]
discrimination between slot and inter-phase partial discharge
sources [see Section 7.1 on Slot-based (Classic PD)] -10 -10
-20 -20
The standard LPD report contains six graphs organized in
three rows, one for each phase, and two columns, one per PD -30 -30
classification. The data can be displayed in Standard form, 0 45 90 135 180 225 270 315 360
Phase Angle [deg]
where all three phases are shown relative to their respective Figure 34: LPD or PRPD plot
phase-to-ground voltages (Figure 35); or in phase-shifted form,
where the first row of graphs displays data measured on one phase with no phase shift, and the second row of graphs displays
data measured on the second phase but with the phase-angle scale shifted 120° from the first phase. The third row of graphs
displays data measured on the third phase shifted 240° from the first phase (Figure 36). Thus, the sinusoidal phase voltages are
displayed as they occur simultaneously in time. This allows for quick identification of phase-to-phase voltage dependent
discharge sources and cross-coupled PD clusters. In this configuration pulses from the same source, such as inter-phase arcing
or cross-coupling will align vertically.
www.irispower.com
30 | P ag e