
Page 31 - Basic PD Theory
P. 31
PD Data Types
4
Chapter
4 Data Types
Overview of PD Data Types
T
his is only an overview of the data types. Data collection instruments can either be portable used for periodic testing,
or can be permanently mounted for continuous monitoring. Additionally, data collection instruments can be capable
of collecting pulse height analysis plots, PD summary variables, archived PD data, and/or phase-resolved PD data.
Please refer to the appropriate user’s manual for further information. For information regarding pulse categories, refer
to Appendix E. Zone of Coverage.
4.1 Pulse Height Analysis (PHA)
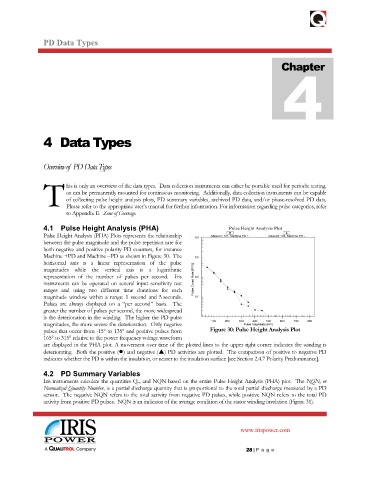
Pulse Height Analysis (PHA) Plots represents the relationship
between the pulse magnitude and the pulse repetition rate for
both negative and positive polarity PD counters, for instance
Machine +PD and Machine –PD as shown in Figure 30. The
horizontal axis is a linear representation of the pulse
magnitudes while the vertical axis is a logarithmic
representation of the number of pulses per second. Iris
instruments can be operated on several input sensitivity test
ranges and using two different time durations for each
magnitude window within a range: 1 second and 5 seconds.
Pulses are always displayed on a “per second” basis. The
greater the number of pulses per second, the more widespread
is the deterioration in the winding. The higher the PD pulse
magnitudes, the more severe the deterioration. Only negative
pulses that occur from -15° to 135° and positive pulses from Figure 30: Pulse Height Analysis Plot
165° to 315° relative to the power frequency voltage waveform
are displayed in the PHA plot. A movement over time of the plotted lines to the upper right corner indicates the winding is
deteriorating. Both the positive () and negative () PD activities are plotted. The comparison of positive to negative PD
indicates whether the PD is within the insulation, or nearer to the insulation surface [see Section 2.4.7 Polarity Predominance].
4.2 PD Summary Variables
Iris instruments calculate the quantities Q m and NQN based on the entire Pulse Height Analysis (PHA) plot. The NQN, or
Normalized Quantity Number, is a partial discharge quantity that is proportional to the total partial discharge measured by a PD
sensor. The negative NQN refers to the total activity from negative PD pulses, while positive NQN refers to the total PD
activity from positive PD pulses. NQN is an indicator of the average condition of the stator winding insulation (Figure 31).
www.irispower.com
28 | P ag e