
Page 31 - 87099_NSAA_ JournalSpring2019_Online File2_Neat
P. 31
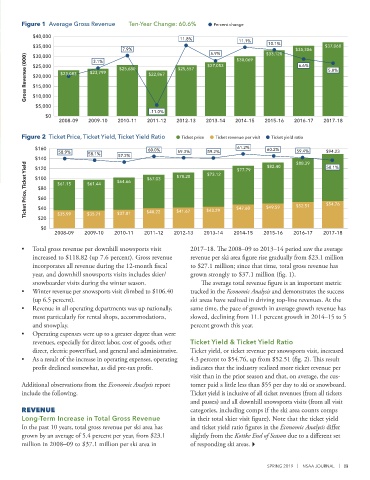
NSAA         Figure 1  Average Gross Revenue    Ten-Year Change: 60.6%      Percent change

                 $40,000
                 $40,000
                                                                  11.8%
                                                                                     11.1%     10.1%
                 $35,000
                 $35,000                                                                                          $37,068
                                               7.9%                         5.9%     $30,069  $33,120   $35,306
               Gross Revenue (000)  $25,000  $23,083  $23,799  $25,680  $22,867  $25,557  $27,053        6.6%      5.0%
                 $30,000
                 $30,000
                                     3.1%
                 $25,000
                 $20,000
                 $20,000
                 $15,000
                 $15,000
                 $10,000
                 $10,000
                  $5,000
                  $5,000
                                                        -11.0%
                     $0
                     $0
                          2008–09   2009–10  2010–11   2011–12   2012–13   2013–14  2014–15   2015–16   2016–17  2017–18
                          2008–09
                                    2009–10
                                                                           2013–14
                                                                 2012–13
                                                                                    2014–15
                                                       2011–12
                                                                                                        2016–17
                                                                                              2015–16
                                             2010–11
                                                                                                                 2017–18
 FINAL RESULTS  Breakdown of the   Figure 2  Ticket Price, Ticket Yield, Ticket Yield Ratio  Ticket price  Ticket revenue per visit  60.2%
                                                                                                Ticket yield ratio
 2017–18 Season
                                                                                     61.2%
                  $160
                                                       60.0%
                                                                                                         59.4%
                  $140    58.9%     58.1%    57.2%               59.3%     59.2%                        $88.39    $94.23
               Ticket Price, Ticket Yield  $80  $61.15   $61.44                      $47.60    $49.59   $52.51    $54.76
 BY DAVE BELIN, DIRECTOR OF CONSULTING SERVICES, RRC ASSOCIATES  $120  $64.66   $67.03   $70.28   $73.12  $77.79  $82.40  58.1%
                  $100
                   $60
                   $40
                   $20
                    $0   $35.99    $35.71    $37.01    $40.22    $41.67    $43.29
                        2008–09   2009–10   2010–11   2011–12   2012–13   2013–14   2014–15   2015–16   2016–17  2017–18
              •  Total gross revenue per downhill snowsports visit   2017–18. The 2008–09 to 2013–14 period saw the average
                 increased to $118.82 (up 7.6 percent). Gross revenue    revenue per ski area figure rise gradually from $23.1 million
                 incorporates all revenue during the 12-month fiscal    to $27.1 million; since that time, total gross revenue has
                 year, and downhill snowsports visits includes skier/   grown strongly to $37.1 million (fig. 1).
                 snowboarder visits during the winter season.            The average total revenue figure is an important metric
              •  Winter revenue per snowsports visit climbed to $106.40   tracked in the Economic Analysis and demonstrates the success
                 (up 6.5 percent).                                   ski areas have realized in driving top-line revenues. At the
              •   Revenue in all operating departments was up nationally,    same time, the pace of growth in average growth revenue has
                 most particularly for rental shops, accommodations,   slowed, declining from 11.1 percent growth in 2014–15 to 5
                 and snowplay.                                       percent growth this year.
              •   Operating expenses were up to a greater degree than were
                 revenues, especially for direct labor, cost of goods, other   Ticket Yield & Ticket Yield Ratio
                 direct, electric power/fuel, and general and administrative.  Ticket yield, or ticket revenue per snowsports visit, increased
              •  As a result of the increase in operating expenses, operating   4.3 percent to $54.76, up from $52.51 (fig. 2). This result
                 profit declined somewhat, as did pre-tax profit.    indicates that the industry realized more ticket revenue per
                                                                     visit than in the prior season and that, on average, the cus-
              Additional observations from the Economic Analysis report   tomer paid a little less than $55 per day to ski or snowboard.
              include the following.                                 Ticket yield is inclusive of all ticket revenues (from all tickets
                                                                     and passes) and all downhill snowsports visits (from all visit
              REVENUE                                                categories, including comps if the ski area counts comps
              Long-Term Increase in Total Gross Revenue              in their total skier visit figure). Note that the ticket yield
              In the past 10 years, total gross revenue per ski area has   and ticket yield ratio figures in the Economic Analysis differ
              grown by an average of 5.4 percent per year, from $23.1    slightly from the Kottke End of Season due to a different set
              million in 2008–09 to $37.1 million per ski area in    of responding ski areas.


                                                                                               SPRING 2019  |  NSAA JOURNAL  |  29