
Page 32 - 87099_NSAA_ JournalSpring2019_Online File2_Neat
P. 32
On the other hand, ticket yield ratio, which expresses consistency with which revenue growth has occurred across
the relationship between ticket yield and ticket price, was various ski area departments.
58.1 percent in 2017–18, down slightly from 59.4 percent,
indicating that the increases in ticket revenue per visit are not SUMMER/FALL REVENUE
keeping up with the increases in weekend adult ticket price. Summer/Fall Revenues Up
The figure was down slightly from 58.9 percent in the 2008–09 Many ski areas have invested in summer operations, profit
season, though the ratio was generally higher (around 60 per- centers, festivals, events, concerts, and other attractions.
cent) in the 2011–12 to 2015–16 season period. The ticket Nationally, four out of five US ski areas operate in the
yield ratio declines when the window price goes up more non-winter months, and among that group of resorts, the
than does ticket yield, and ticket yield ratio goes up when summer period contributes 12 percent to annual revenue, up
increases in ticket yield outpace increases in window ticket from 10.6 percent last year and 7.2 percent 10 seasons ago.
price. In general, the more season passes a ski area sells, the Of those ski resorts with non-winter operations, the
lower the ticket yield ratio would be, because passholders average level of summer revenue is $5.1 million, up 14.9
generally end up paying less per visit than do daily or percent from $4.6 million in 2016–17. The two largest
multi-day ticket purchasers. departments/activities for summer revenue nationally are
food and beverage ($1.3 million on average, up 7.3 percent)
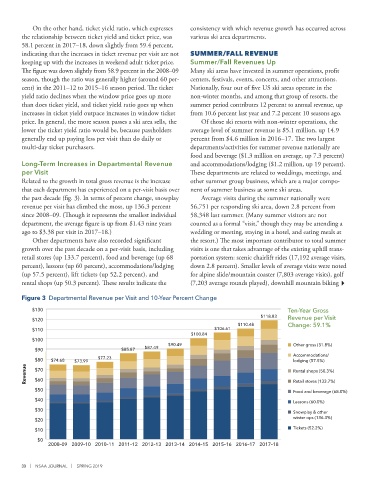
Long-Term Increases in Departmental Revenue and accommodations/lodging ($1.2 million, up 19 percent).
per Visit These departments are related to weddings, meetings, and
Related to the growth in total gross revenue is the increase other summer group business, which are a major compo-
that each department has experienced on a per-visit basis over nent of summer business at some ski areas.
the past decade (fig. 3). In terms of percent change, snowplay Average visits during the summer nationally were
revenue per visit has climbed the most, up 136.3 percent 56,751 per responding ski area, down 2.8 percent from
since 2008–09. (Though it represents the smallest individual 58,348 last summer. (Many summer visitors are not
department, the average figure is up from $1.43 nine years counted as a formal “visit,” though they may be attending a
ago to $3.38 per visit in 2017–18.) wedding or meeting, staying in a hotel, and eating meals at
Other departments have also recorded significant the resort.) The most important contributor to total summer
growth over the past decade on a per-visit basis, including visits is one that takes advantage of the existing uphill trans-
retail stores (up 133.7 percent), food and beverage (up 68 portation system: scenic chairlift rides (17,192 average visits,
percent), lessons (up 60 percent), accommodations/lodging down 2.8 percent). Smaller levels of average visits were noted
(up 57.5 percent), lift tickets (up 52.2 percent), and for alpine slide/mountain coaster (7,803 average visits), golf
rental shops (up 50.3 percent). These results indicate the (7,203 average rounds played), downhill mountain biking
Figure 3 Departmental Revenue per Visit and 10-Year Percent Change
$130 Ten-Year Gross
$118.83
$120 Revenue per Visit
$110.48 Change: 59.1%
$110 $106.61
$100.84
$100
$90.49 Other gross (31.8%)
$87.49
$90 $85.87
Accommodations/
$80 $74.68 $73.99 $77.23 lodging (57.5%)
Revenue $70 Rental shops (50.3%)
$60
Retail stores (133.7%)
$50 Food and beverage (68.0%)
$40
Lessons (60.0%)
$30
Snowplay & other
winter ops (136.3%)
$20
Tickets (52.2%)
$10
$0
2008–09 2009–10 2010–11 2011–12 2012–13 2013–14 2014–15 2015–16 2016–17 2017–18
30 | NSAA JOURNAL | SPRING 2019