
Page 34 - 87099_NSAA_ JournalSpring2019_Online File2_Neat
P. 34
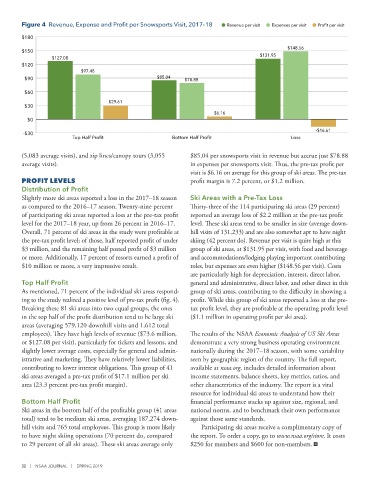
Figure 4  Revenue, Expense and Profit per Snowsports Visit, 2017–18  Revenue per visit  Expenses per visit  Profit per visit

              $180
                                                                                                      $148.56
              $150
                                                                                            $131.95
                        $127.08
              $120
                                 $97.48
               $90                                        $85.04    $78.88

               $60
                                          $29.61
               $30
                                                                             $6.16
                $0
                                                                                                               -$16.61
              -$30
                              Top Half Profit                   Bottom Half Profit                       Loss

              (5,083 average visits), and zip lines/canopy tours (3,055    $85.04 per snowsports visit in revenue but accrue just $78.88
              average visits).                                       in expenses per snowsports visit. Thus, the pre-tax profit per
                                                                     visit is $6.16 on average for this group of ski areas. The pre-tax
              PROFIT LEVELS                                          profit margin is 7.2 percent, or $1.2 million.
              Distribution of Profit                                                                                                                                                              45
              Slightly more ski areas reported a loss in the 2017–18 season   Ski Areas with a Pre-Tax Loss
              as compared to the 2016–17 season. Twenty-nine percent   Thirty-three of the 114 participating ski areas (29 percent)
              of participating ski areas reported a loss at the pre-tax profit   reported an average loss of $2.2 million at the pre-tax profit
              level for the 2017–18 year, up from 26 percent in 2016–17.    level. These ski areas tend to be smaller in size (average down-
              Overall, 71 percent of ski areas in the study were profitable at   hill visits of 131,233) and are also somewhat apt to have night
              the pre-tax profit level; of those, half reported profit of under   skiing (42 percent do). Revenue per visit is quite high at this
              $3 million, and the remaining half posted profit of $3 million   group of ski areas, at $131.95 per visit, with food and beverage
              or more. Additionally, 17 percent of resorts earned a profit of   and accommodations/lodging playing important contributing
              $10 million or more, a very impressive result.         roles, but expenses are even higher ($148.56 per visit). Costs                                                                       YEARS
                                                                     are particularly high for depreciation, interest, direct labor,
              Top Half Profit                                        general and administrative, direct labor, and other direct in this
              As mentioned, 71 percent of the individual ski areas respond-  group of ski areas, contributing to the difficulty in showing a
              ing to the study realized a positive level of pre-tax profit (fig. 4).    profit. While this group of ski areas reported a loss at the pre-
              Breaking these 81 ski areas into two equal groups, the ones   tax profit level, they are profitable at the operating profit level
              in the top half of the profit distribution tend to be large ski   ($1.1 million in operating profit per ski area).
              areas (averaging 579,120 downhill visits and 1,612 total                                                                                    Since 1974 SMI has been committed to
              employees). They have high levels of revenue ($73.6 million,   The results of the NSAA Economic Analysis of US Ski Areas                    being your total snowmaking partner.
              or $127.08 per visit), particularly for tickets and lessons, and   demonstrate a very strong business operating environment             What started as building our first product, the 320 in our founders
              slightly lower average costs, especially for general and admin-  nationally during the 2017–18 season, with some variability            garage has developed into SMI products on 5 continents, 7 Winter   +1.989.631.6091
              istrative and marketing. They have relatively lower liabilities,    seen by geographic region of the country. The full report,                                                                         SNO WMAKERS. C OM
                                                                                                                                                                                                                     F A CEBOOK. C OM/SNO WMAKERS
              contributing to lower interest obligations. This group of 41   available at nsaa.org, includes detailed information about             Olympics, master planning, engineering, automation, service and of   SNO WMAKERS. C OM
              ski areas averaged a pre-tax profit of $17.1 million per ski   income statements, balance sheets, key metrics, ratios, and            course our rugged, low e and intuitive product lines. Thank you for
              area (23.3 percent pre-tax profit margin).             other characteristics of the industry. The report is a vital                  choosing us. We can’t wait to see what the next 45 years bring.
                                                                     resource for individual ski areas to understand how their
              Bottom Half Profit                                     financial performance stacks up against size, regional, and
              Ski areas in the bottom half of the profitable group (41 areas   national norms, and to benchmark their own performance
              total) tend to be medium ski areas, averaging 187,274 down-  against those same standards.
              hill visits and 765 total employees. This group is more likely   Participating ski areas receive a complimentary copy of
              to have night skiing operations (70 percent do, compared   the report. To order a copy, go to www.nsaa.org/store. It costs
              to 29 percent of all ski areas). These ski areas average only   $250 for members and $600 for non-members.


                                                                                                                                         T E C H N O L O G Y                  +       L O N G E V I T Y                +
              32  |  NSAA JOURNAL  |  SPRING 2019                                                                                                                                                                               S E R V I C E