


Page 61 - Handout of Rreport Writting
P. 61
Faculty of Engineering


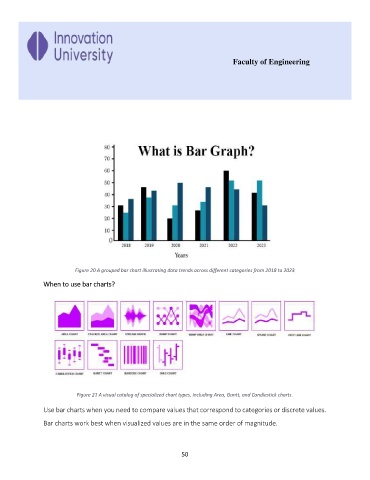
                          Figure 20 A grouped bar chart illustrating data trends across different categories from 2018 to 2023

               When to use bar charts?


                          Figure 21 A visual catalog of specialized chart types, including Area, Gantt, and Candlestick charts.

               Use bar charts when you need to compare values that correspond to categories or discrete values.

               Bar charts work best when visualized values are in the same order of magnitude.


                                                             50

