
Page 48 - KGR 2020-21 Annual Report
P. 48
SECURITY STAFF AND
COUNTER POACHING
RESULTS
Wildlife protection through counter poaching is a key responsibility of Karingani in this greater landscape – with
a constantly adapting poaching pressure from outside the reserve, targeting endangered rhino and elephant
populations, as well as the “bushmeat “ trade, Karingani has further developed their counter poaching resources
during this reporting period. Key to this strategy is the collection and analysis of data, on a day to day, real-time basis
to both measure the level of threat and the amount of effort towards addressing those threats. Field ranger training,
support and ultimately long-term retention of those individuals is critical in being able to build long-term and robust
counter poaching strategies and form the key components in Karingani counter poaching strategy.
KPI 1 | WILDLIFE SECURITY
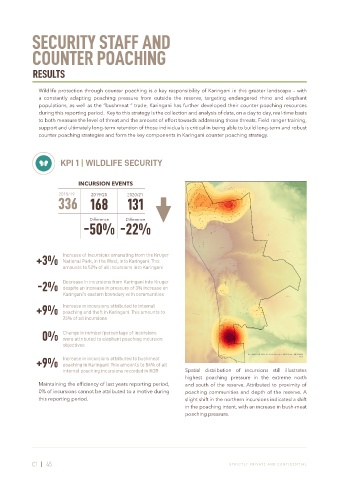
INCURSION EVENTS
2018/19 2019/20 2020/21
336 168 131
Difference Difference
-50% -22%
+3% Increase of incursions emanating from the Kruger
National Park, in the West, into Karingani. This
amounts to 52% of all incursions into Karingani
-2% Decrease in incursions from Karingani into Kruger
despite an increase in pressure of 3% increase on
Karingani’s eastern boundary with communities
Increase in incursions attributed to Internal
+9% poaching and theft in Karingani. This amounts to
25% of all incursions
Change in number/percentage of incursions
0% were attributed to elephant poaching incursion
objectives
Esri, NASA, NGA, USGS, Esri South Africa, Esri, HERE, Garmin, METI/NASA,
Increase in incursions attributed to bushmeat USGS
+9% poaching in Karingani. This amounts to 84% of all
internal poaching incursions recorded in KGR Spatial distribution of incursions still illustrates
highest poaching pressure in the extreme north
Maintaining the efficiency of last years reporting period, and south of the reserve. Attributed to proximity of
0% of incursions cannot be attributed to a motive during poaching communities and depth of the reserve. A
this reporting period. slight shift in the northern incursions indicated a shift
in the poaching intent, with an increase in bush-meat
poaching pressure.
C1 | 45 STRICTLY PRIV ATE AND CONFIDENTIAL