
Page 8 - Jurnal Penelitian MTsN 6 Jakarta
P. 8
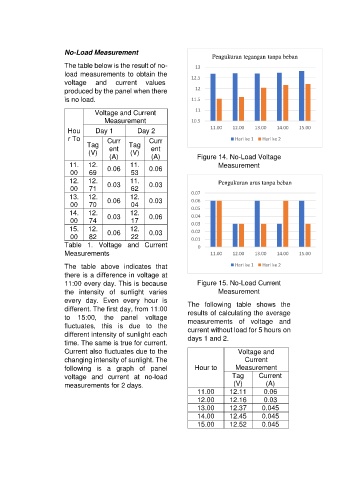
No-Load Measurement
                                                                            Pengukuran tegangan tanpa beban
                        The table below is the result of no-          13
                        load measurements to obtain the             12.5
                        voltage    and    current   values
                        produced by the panel when there              12
                        is no load.                                 11.5

                                  Voltage and Current                 11
                                      Measurement                   10.5
                         Hou       Day 1         Day 2                     11.00   12.00  13.00   14.00   15.00
                         r To          Curr          Curr                           Hari ke 1  Hari ke 2
                                Tag    ent    Tag     ent
                                (V)            (V)
                                       (A)            (A)             Figure 14. No-Load Voltage
                         11.    12.    0.06    11.   0.06                     Measurement
                          00    69             53
                         12.    12.    0.03    11.   0.03                     Pengukuran arus tanpa beban
                          00    71             62
                         13.    12.    0.06    12.   0.03           0.07
                          00    70             04                   0.06
                         14.    12.    0.03    12.   0.06           0.05
                                                                    0.04
                          00    74             17                   0.03
                         15.    12.    0.06    12.   0.03           0.02
                          00    82             22                   0.01
                        Table  1.  Voltage  and  Current               0
                        Measurements                                       11.00   12.00  13.00   14.00   15.00

                        The  table  above  indicates  that                          Hari ke 1  Hari ke 2
                        there is a difference in voltage at
                        11:00 every day. This is because              Figure 15. No-Load Current
                        the  intensity  of  sunlight  varies                  Measurement
                        every  day.  Even  every  hour  is         The  following  table  shows  the
                        different. The first day, from 11:00       results of calculating the average
                        to  15:00,  the  panel  voltage            measurements  of  voltage  and
                        fluctuates,  this  is  due  to  the        current without load for 5 hours on
                        different intensity of sunlight each       days 1 and 2.
                        time. The same is true for current.
                        Current also fluctuates due to the                           Voltage and
                        changing intensity of sunlight. The                            Current
                        following  is  a  graph  of  panel           Hour to        Measurement
                        voltage  and  current  at  no-load                         Tag      Current
                        measurements for 2 days.                                   (V)        (A)
                                                                      11.00       12.11       0.06
                                                                      12.00       12.16       0.03
                                                                      13.00       12.37      0.045
                                                                      14.00       12.45      0.045
                                                                      15.00       12.52      0.045