
Page 344 - Area 2 Para E
P. 344
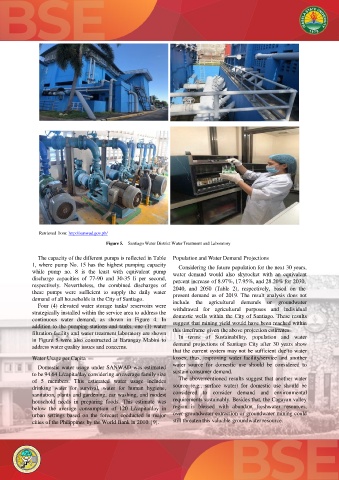
Retrieved from: http://sanwad.gov.ph/

                                      Figure 5.  Santiago Water District Water Treatment and Laboratory

              The capacity of the different pumps is reflected in Table  Population and Water Demand Projections
            1, where pump No. 15 has the highest pumping capacity  Considering the future population for the next 30 years,
            while pump no. 8 is the least with equivalent pump  water demand would also skyrocket with an equivalent
            discharge capacities of 77-90 and 30-35 li per second,  percent increase of 8.97%, 17.95%, and 28.20% for 2030,
            respectively. Nevertheless, the combined discharges of  2040, and 2050 (Table 2), respectively, based on the
            these pumps were sufficient to supply the daily water  present demand as of 2019. The result analysis does not
            demand of all households in the City of Santiago.  include  the  agricultural  demands  or  groundwater
              Four (4) elevated water storage tanks/ reservoirs were
            strategically installed within the service area to address the  withdrawal for agricultural purposes and individual
                                                              domestic wells within the City of Santiago. These results
            continuous water demand, as shown in Figure 4. In  suggest that mining yield would have been reached within
            addition to the pumping stations and tanks, one (1) water  this timeframe given the above projection estimates.
            filtration facility and water treatment laboratory are shown  In terms of Sustainability, population and water
            in Figure 5 were also constructed at Barangay Mabini to
            address water quality issues and concerns.        demand projections of Santiago City after 30 years show
                                                              that the current system may not be sufficient due to water
            Water Usage per Capita                            losses; thus, improving water facility/service and another
                                                              water source for domestic use should be considered to
              Domestic water usage under SANWAD was estimated
            to be 94.64 L/capita/day considering an average family size  sustain consumer demand.
            of 5 members. This estimated water usage includes   The abovementioned results suggest that another water
            drinking water for survival, water for human hygiene,  source (e.g., surface water) for domestic use should be
            sanitation, plants and gardening, car washing, and modest  considered to consider demand and environmental
            household needs in preparing foods. This estimate was  requirements sustainably. Besides that, the Cagayan valley
            below the average consumption of 120 L/capita/day in  region is blessed with abundant freshwater resources,
            urban settings based on the forecast conducted in major  over-groundwater extraction or groundwater mining could
            cities of the Philippines by the World Bank in 2010. [9].  still threaten this valuable groundwater resource.