
Page 113 - Theoretical and Practical Interpretation of Investment Attractiveness
P. 113
1.2. calculation of other indicators based on statistical data (for example, profitability,
net profit, production growth index, etc.).
1. Calculation of integral indicators for each region for the analyzed period (for each
year) (to determine the dynamics).
To determine the “regional average” (“regional average”) indicator, it is considered to
carry out an intermediate calculation for each indicator and bring the district values closer to
it (i.e., carry out a standardization process).
Normalization to the “maximum rank by region” is also possible (this is done at the
discretion of the expert and does not affect the final distribution).
are entered into the intermediate table.
2. integral indicators for the main internal activity of each district and determining
the main “growth point” of the district’s economy, to highlight three types of economic
activity with the maximum value.
3. Dividing districts into simple colors (using MS Excel tools), distributing seats from
-1 to n by the number of districts in the region and tabulating the data.
2nd stage. Assessing the potential of districts in terms of quality. It consists of the
following:
1. Dividing districts into colors taking into account “expert measurements” of the main
indicators:
1.1) Based on the results of a survey of experts (for example, relevant specialists
from district executive committees), the most basic indicators are selected from the indicators
obtained at the 1st stage (points 1.1-1.2). They are divided into colors according to the level
of significance for the criterial description of the investment attractiveness of the area and
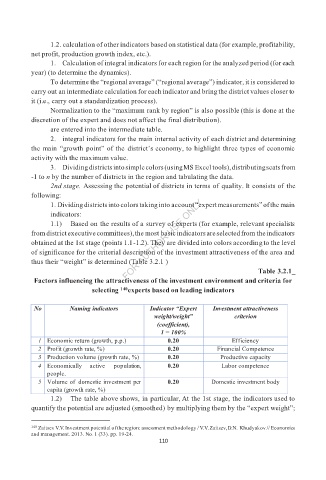
thus their “weight” is determined (Table 3.2.1 )
Table 3.2.1_
Factors influencing the attractiveness of the investment environment and criteria for
selecting 140 experts based on leading indicators
No Naming indicators Indicator “Expert Investment attractiveness
weight/weight” criterion
(coefficient),
1 = 100%
1 Economic return (growth, p.p.) 0.20 Efficiency
2 Profit (growth rate, %) 0.20 Financial Competence
3 Production volume (growth rate, %) 0.20 Productive capacity
4 Economically active population, 0.20 Labor competence
people.
5 Volume of domestic investment per 0.20 Domestic investment body
capita (growth rate, %)
1.2) The table above shows, in particular, At the 1st stage, the indicators used to
quantify the potential are adjusted (smoothed) by multiplying them by the “expert weight”;
140 Zaitsev V.V. Investment potential of the region: assessment methodology / V.V. Zaitsev, D.N. Khudyakov // Economics
and management. 2013. No. 1 (33). pp. 19-24.
110