
Page 114 - Theoretical and Practical Interpretation of Investment Attractiveness
P. 114
1.3) all indicators (dividing them into important ones according to “expert weight”)
are included in the intermediate table ;
1.4) Based on the intermediate table, the integral indicator for each district is
recalculated;
1.5) correction (smoothing) of the main indicators of i districts (based on the new
sum of integral indicators) is again divided into colors.
2. Dividing districts into colors using the matrix method (using the term “BMK
matrix”) based on the main criteria indicators characterizing important elements of investment
potential:
2.1) According to the relevant indicators (level 2 of clause 1.1) on the basis of a
single base (growth rate of investment in fixed capital), the regions are divided into quadrants
of the matrix (table 3.2.2)
- the growth rate of capital investment in each region;
- the number of indicators for each district is written horizontally;
- As a result, each district is placed in one of the quadrants of the emerging matrix. The
area divided into vertical and horizontal quadrants is determined by the arithmetic average of
all values of the corresponding indicators;
- The quadrants of the matrix are assigned a color from 1 to 4 (from “outsiders” to “
standing leaders”).
If investment attractiveness k (IJ) if it is determined by the speed of development of
factors describing the rapid development of hud ud , then only the values of indicators related
to speed are used (except for numbers, units of measurement).
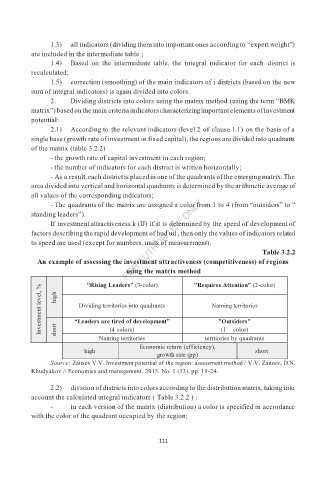
Table 3.2.2
An example of assessing the investment attractiveness (competitiveness) of regions
using the matrix method
Investment level, % high “Leaders are tired of development” Naming territories
"Rising Leaders" (3-color)
"Requires Attention" (2-color)
Dividing territories into quadrants
"Outsiders"
short
(4 colors)
(1 – color)
Naming territories territories by quadrants
Economic return (efficiency),
high short
growth rate (pp)
Source: Zaitsev V.V. Investment potential of the region: assessment method / V.V. Zaitsev, D.N.
Khudyakov // Economics and management. 2013. No. 1 (33). pp. 19-24.
2.2) division of districts into colors according to the distribution matrix, taking into
account the calculated integral indicators ( Table 3.2.2 ) :
- in each version of the matrix (distribution) a color is specified in accordance
with the color of the quadrant occupied by the region;
111