
Page 115 - Theoretical and Practical Interpretation of Investment Attractiveness
P. 115
- the fog color is multiplied by the “expert weight” of the indicator corresponding
to the corresponding matrix option;
- the region is divided into quadrants and for each region an integral indicator is
determined by calculating the arithmetic mean of all “color-weight” values of the matrix for
all options;
- The districts are divided into colors according to the obtained integral indicators
and stage 2 1.3 . The table of intervals in the paragraph has been corrected.
3rd stage. Final adjustment of district indicators based on quantitative and qualitative
assessment of their investment potential .
2.2 in step 2. Based on the values obtained in the last subparagraph of the paragraph,
the arithmetic average is determined and the quantitative analysis is adjusted with its help. At
the next stage, it is again divided into simple colors in descending order and the results are
entered into the final rating (point 4 of the 1st step). Then the most competitive types of
activities are identified and placed on the map of investment attractiveness of the district
(Table 3.2.3).
At the moment, the above technique has advantages:
- considers the investment attractiveness and investment activity that determine the
investment potential of the region in relation to each other; investments are considered in the
dynamics of attractiveness/activity;
- flexibility of the methodology according to goals - it can be adapted to various goals
(both potential investors and the goals of government authorities);
- the flexibility of the data methodology is not strictly tied to specific indicators (the
composition of investment-relevant indicators cannot remain unchanged to determine the
integral (comprehensive) investment attractiveness of the region and must partially change
depending on the characteristics of each stage of development of the economy of Uzbekistan).
It should be noted that a number of factors, such as: mineral resources, natural reserves
(these factors are included in the indicators of the natural-geographical potential of the region,
are calculated based on the area of the region and per capita). ) are not taken into account in
our study. the overall crime rate in the area; level of environmental pollution and unfavorable
climate; the political situation, which foreign investors pay great attention to, is not taken into
account.
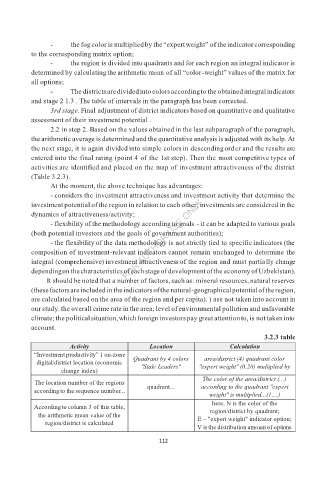
3.2.3 table
Activity Location Calculation
“Investment productivity” 1 on-zone Quadrant by 4 colors area/district (4) quadrant color
digital/district location (economic
"Stale Leaders" "expert weight" (0.20) multiplied by
change index)
The color of the area/district (...)
The location number of the regions
quadrant... according to the quadrant "expert
according to the sequence number...
weight" is multiplied...(1,...)
here, N is the color of the
According to column 3 of this table,
region/district by quadrant;
the arithmetic mean value of the
E – "expert weight" indicator option;
region/district is calculated
V is the distribution amount of options.
112