
Page 147 - Theoretical and Practical Interpretation of Investment Attractiveness
P. 147
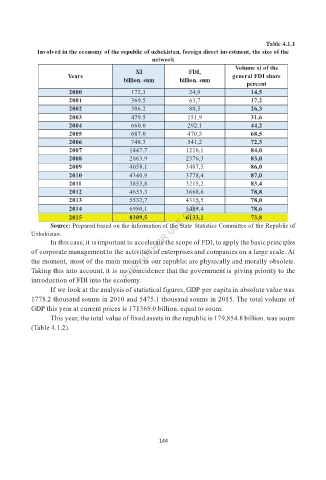
Table 4.1.1
           Involved in the economy of the republic of uzbekistan, foreign direct investment, the size of the
                                         network
                                                              Volume xi of the
                                    XI            FDI,
                   Years                                      general FDI share
                                 billion. sum   billion. sum
                                                                 percent
                   2000            172,3          24,9            14,5
                   2001            369.5          63,7            17,2
                   2002            306.2          80,5            26,3
                   2003            479.5          151,9           31,6
                   2004            660.0          292,1           44,2
                   2005            687.0          470,5           68,5
                   2006            748.3          541,2           72,3
                   2007            1447.7        1216,1           84,0
                   2008            2863.9        2376,3           83,0
                   2009            4058.1        3487,5           86,0
                   2010            4340.9        3778,4           87,0
                   2011            3853,8        3215,2           83,4
                   2012            4653,3        3668,6           78,8
                   2013            5532,7        4315,5           78,0
                   2014            6980,1        5489,4           78,6
                   2015            8309,5        6133,1           73,8
              Source: Prepared based on the information of the State Statistics Committee of the Republic of
         Uzbekistan.
              In this case, it is important to accelerate the scope of FDI, to apply the basic principles
         of corporate management to the activities of enterprises and companies on a large scale. At
         the moment,  most of the main means in our republic are physically and morally obsolete.
         Taking this into account, it is no coincidence that the government is giving priority to the
         introduction of FDI into the economy.
              If we look at the analysis of statistical figures, GDP per capita in absolute value was
         1778.2 thousand soums in 2010 and 5475.1 thousand soums in 2015. The total volume of
         GDP this year at current prices is 171369.0 billion. equal to soum.
              This year, the total value of fixed assets in the republic is 179,854.8 billion. was soum
         (Table 4.1.2).


                                          144