
Page 149 - Theoretical and Practical Interpretation of Investment Attractiveness
P. 149
If we analyze in the cross-section of regions, where the production forces are more
located, the volume of GNI created in that area was also higher. For example, in 2014 and
2015, the current value of the main funds in Tashkent was the highest (44,718.7 billion soums,
ranked 1st among 14 economic and administrative regions). 648.7 billion soums).
The total value of the existing and valid main funds in the Tashkent region is second
only to the city of Tashkent. In these years, the total volume of goods and services, that is,
GNI, was 16,558.6 billion. amounting to soums, occupying the second place among 14
administrative regions. If we assume that there is a high economic correlation between the
two factors, it is possible to estimate the GNI of the republic's regions based on the value of
the main funds (presented in Appendix 4).
By analyzing the statistical data shown in Table 4.1.2, the following conclusions can
be reached.
As we mentioned before, the high rate of growth of the production volume in relation
to the growth of the population indicates the growth of the scale effect. Having a positive
(increasing) scale effect in production indicates an increase in the volume of production per
capita, income per capita, as well as an increase in factor productivity (productivity).
In 2015, the absolute additional growth of the population was 3021.1 thousand people.
Through this indicator, it is possible to clearly see how many units the level of the comparative
period is greater than the comparative period, that is, 2010. The same indicator in GDP -
108980.7 bln. soums, in investments in fixed capital - 26331.8 bln. soums, per capita
investments amounted to 788 thousand soums.
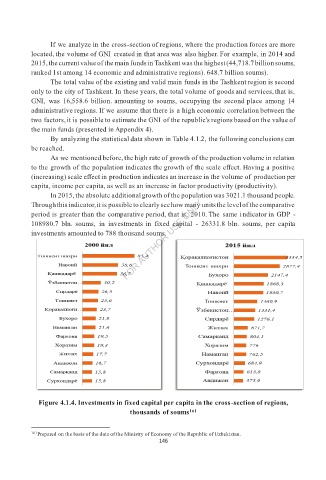
Figure 4.1.4. Investments in fixed capital per capita in the cross-section of regions,
thousands of soums 161
161 Prepared on the basis of the data of the Ministry of Economy of the Republic of Uzbekistan.
146