
Page 148 - Theoretical and Practical Interpretation of Investment Attractiveness
P. 148
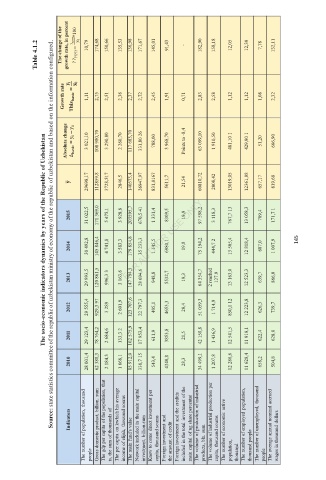
Table 4.1.2 The change of the growth rate, in percent ǫǫ ǫǫǫǫǫ ൌ ǫ ǫǫǫǫǫ *100 ୷ బ 10,79 174,68 150,66 135,53 136,98 171,67 145,01 91,43 - 182,90 158,18 12,05 12,30 7,78 132,11
Source: state statistics committee of the republic of uzbekistan ministry of economy of the republic of uzbekistan and based on the information configured.
Growth rate ܡ ܑ ܂ܐܑܛ ܊܉ܛܑ܋ ൌ ܡ 1,11 2,75 2,51 2,36 2,37 2,72 2,45 1,91 0,71 2,83 2,58 1,12 1,12 1,08 2,32
Absolute change ο ୠୟୱ୧ୡ ൌ ୧ െ 3 021,10 108 980,70 3 290,80 2 260,70 117 683,70 331,80 26 788,00 3 968,70 Points to -8,4 63 099,10 1 910,50 481,10 1 429,90 1 51,20 666,90
The socio-economic indicators dynamics by years of the Republic of Uzbekistan
ܡ 29698,17 112859,8 3728,517 2846,5 140573,4 26947,97 831,0167 5611,7 21,54 60810,72 2008,42 13019,05 12361,88 657,17 819,68
2015 31 022,5 171 369,0 5 475,1 3 928,8 203595,7 670,5 41 1 331,4 8309,5 19,9 97 598,2 3 118,3 767,7 13 13 058,3 709,4 171,7 1
2014 30 492,8 145 846,4 4 741,8 3 583,3 179 854,8 35 233,3 1 145,5 6980,1 19,8 75 194,2 444,7 2 13 505,4 12 818,4 687,0 1 007,9 145
2013 29 993,5 120 861,5 996,3 3 3 163,6 147 794,5 28 694,6 948,8 5532,7 19,3 64 354,7 2 reached 127.9 13 163,0 12 523,3 639,7 866,0
2012 29 555,4 929,3 97 3 289 2 601,9 123 707,6 22 797,3 405,1 4653,3 20,4 51 059,3 1 714,9 850,1 12 12 223,8 626,3 739,7
2011 29 123,4 78 764,2 2 684,6 133,3 2 102 575,9 17 953,4 611,9 3853,8 21,5 42 158,8 1 436,9 12 541,5 11 919,1 622,4 628,0
2010 28 001,4 62 388,3 2 184,3 1 668,1 85 912,0 338,7 15 543,4 4340,8 28,3 34 499,1 1 207,8 12 286,6 11 628,4 658,2 504,8
The number of population, thousand people Gross domestic product, billion. sum is, the sum of thousands of The per capita on kwhich his average income of elijah, thousand soums The main fund's value Network included in the main capital investment, billion.sum Knew to come direct investment per cap
Indicators The gdp per capita of the population, that The volume of industrial production per