
Page 165 - Theoretical and Practical Interpretation of Investment Attractiveness
P. 165
20 Исроил 18
19 Швеция 21
18 Индонезия 23
17 Кипр 24
16 Италия 27
15 Россия 32
14 Мексика 33
13 Франция 34
12 Австралия 36
11 Германия 36
10 Канада 50
9 Хиндистон 51
8 Буюк Британия 59
7 Гонг Конг 68
6 Бразилия 72
5 Ирландия 78
4 Нидерландия 84
3 Сингапур 92
2 Хитой 141
1 Ақш 246
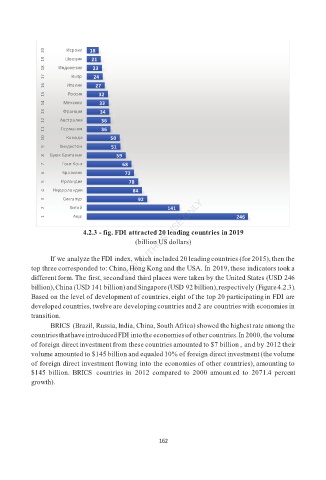
4.2.3 - fig. FDI attracted 20 leading countries in 2019
(billion US dollars)
If we analyze the FDI index, which included 20 leading countries (for 2015), then the
top three corresponded to: China, Hong Kong and the USA. In 2019, these indicators took a
different form. The first, second and third places were taken by the United States (USD 246
billion), China (USD 141 billion) and Singapore (USD 92 billion), respectively (Figure 4.2.3).
Based on the level of development of countries, eight of the top 20 participating in FDI are
developed countries, twelve are developing countries and 2 are countries with economies in
transition.
BRICS (Brazil, Russia, India, China, South Africa) showed the highest rate among the
countries that have introduced FDI into the economies of other countries. In 2000, the volume
of foreign direct investment from these countries amounted to $7 billion , and by 2012 their
volume amounted to $145 billion and equaled 10% of foreign direct investment (the volume
of foreign direct investment flowing into the economies of other countries), amounting to
$145 billion. BRICS countries in 2012 compared to 2000 amounted to 2071.4 percent
growth).
162