
Page 167 - Theoretical and Practical Interpretation of Investment Attractiveness
P. 167
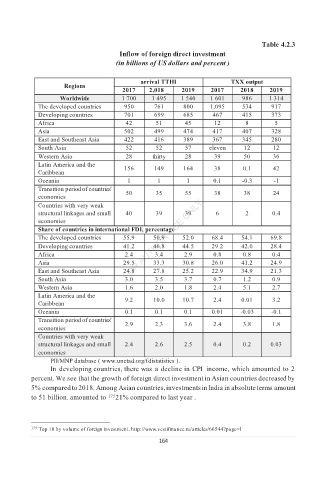
Table 4.2.3
                                Inflow of foreign direct investment
                               (in billions of US dollars and percent )

                                      arrival TTHI           TXX output
                  Regions
                                 2017   2,018 _  2019   2017    2018   2019
                 Worldwide       1 700   1 495   1 540   1 601   986   1 314
           The developed countries   950   761   800    1,095   534     917
           Developing  countries  701    699     685    467     415     373
           Africa                 42      51     45      12      8       5
           Asia                  502     499     474    417     407     328
           East and Southeast Asia   422   416   389    367     345     280
           South Asia             52      52     57     eleven   12     12
           Western Asia           28     thirty  28      39      50     36
           Latin America and the
                                 156     149     164     38     0.1     42
           Caribbean
           Oceania                1       1       1      0.1    -0.3    -1
           Transition period of countries'
                                  50      35     55      38      38     24
           economies
           Countries with very weak
           structural linkages and small   40  39  39    6       2      0.4
           economies
           Share of countries in international FDI, percentage
           The developed countries   55.9   50.9   52.0   68.4   54.1   69.8
           Developing countries  41.2    46.8    44.5   29.2    42.0    28.4
           Africa                 2.4    3.4     2.9     0.8    0.8     0.4
           Asia                  29.5    33.3    30.8   26.0    41.2    24.9
           East and Southeast Asia   24.8   27.8   25.2   22.9   34.9   21.3
           South Asia             3.0    3.5     3.7     0.7    1.2     0.9
           Western Asia           1.6    2.0     1.8     2.4    5.1     2.7
           Latin America and the
                                  9.2    10.0    10.7    2.4    0.01    3.2
           Caribbean
           Oceania                0.1    0.1     0.1    0.01    -0.03   -0.1
           Transition period of countries'
                                  2.9    2.3     3.6     2.4    3.8     1.8
           economies
           Countries with very weak
           structural linkages and small   2.4   2.6   2.5   0.4   0.2   0.03
           economies
              PII/MNP database ( www.unctad.org/fdistatistics ).
              In  developing countries, there was  a decline in CPI  income, which amounted to 2
         percent. We see that the growth of foreign direct investment in Asian countries decreased by
         5% compared to 2018. Among Asian countries, investments in India in absolute terms amount
         to 51 billion. amounted to  175 21% compared to last year .


         175  Top 10 by volume of foreign investment. http://www.vestifinance.ru/articles/66544?page=1
                                          164