
Page 166 - Theoretical and Practical Interpretation of Investment Attractiveness
P. 166
250
227
200
150
125 125
117
99
100
77
59
50 39 36 33 31
25 24 23 23 20 18 16 16 16
0
Япония Ақш Нидерландия Хитой Германия Канада Гонг Конг Франция Жанубий Корея Сингапур Буюк Британия Италия Испания Швеция Россия Белгия Ирландия Дания БАА Бразилия
1 2 3 4 5 6 7 8 9 10 11 12 13 14 15 16 17 18 19 20
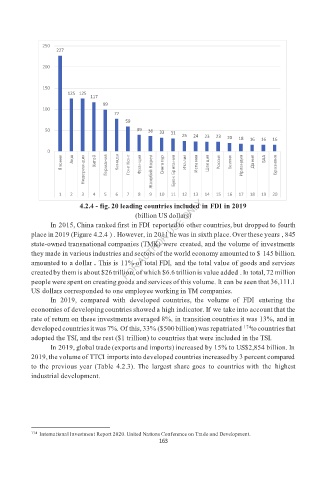
4.2.4 - fig. 20 leading countries included in FDI in 2019
(billion US dollars)
In 2015, China ranked first in FDI reported to other countries, but dropped to fourth
place in 2019 (Figure 4.2.4 ) . However, in 2011 he was in sixth place. Over these years , 845
state-owned transnational companies (TMK) were created, and the volume of investments
they made in various industries and sectors of the world economy amounted to $ 145 billion.
amounted to a dollar . This is 11% of total FDI, and the total value of goods and services
created by them is about $26 trillion, of which $6.6 trillion is value added . In total, 72 million
people were spent on creating goods and services of this volume. It can be seen that 36,111.1
US dollars corresponded to one employee working in TM companies.
In 2019, compared with developed countries, the volume of FDI entering the
economies of developing countries showed a high indicator. If we take into account that the
rate of return on these investments averaged 8%, in transition countries it was 13%, and in
developed countries it was 7%. Of this, 33% ($500 billion) was repatriated 174 to countries that
adopted the TSI, and the rest ($1 trillion) to countries that were included in the TSI.
In 2019, global trade (exports and imports) increased by 15% to US$2,854 billion. In
2019, the volume of TTCI imports into developed countries increased by 3 percent compared
to the previous year (Table 4.2.3). The largest share goes to countries with the highest
industrial development.
174 International Investment Report 2020. United Nations Conference on Trade and Development.
163