
Page 182 - Theoretical and Practical Interpretation of Investment Attractiveness
P. 182
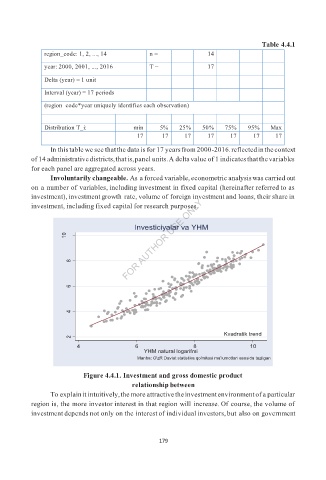
Table 4.4.1
             region_code: 1, 2, ..., 14   n =          14
             year: 2000, 2001, ..., 2016  T  =         17

             Delta (year) = 1 unit
             Interval (year) = 17 periods
             (region_code*year uniquely identifies each observation)

             Distribution T_i:      min    5%   25%   50%   75%   95%   Max
                                     17    17    17    17    17    17    17
              In this table we see that the data is for 17 years from 2000-2016. reflected in the context
         of 14 administrative districts, that is, panel units. A delta value of 1 indicates that the variables
         for each panel are aggregated across years.
              Involuntarily changeable. As a forced variable, econometric analysis was carried out
         on a number of variables, including investment in fixed capital (hereinafter referred to as
         investment), investment growth rate, volume of foreign investment and loans, their share in
         investment, including fixed capital for research purposes.


                                    Investiciyalar va YHM
                  10


                   8


                   6


                   4


                   2                                       Kvadratik trend

                     4              6              8              10
                                       YHM natural logarifmi
                                     Manba: O'zR Davlat statistika qo'mitasi ma'lumotlari asosida tuzilgan

                       Figure 4.4.1. Investment and gross domestic product
                                   relationship between
              To explain it intuitively, the more attractive the investment environment of a particular
         region is, the more investor interest in that region will increase. Of course, the volume of
         investment depends not only on the interest of individual investors, but also on government


                                          179