
Page 276 - Theoretical and Practical Interpretation of Investment Attractiveness
P. 276
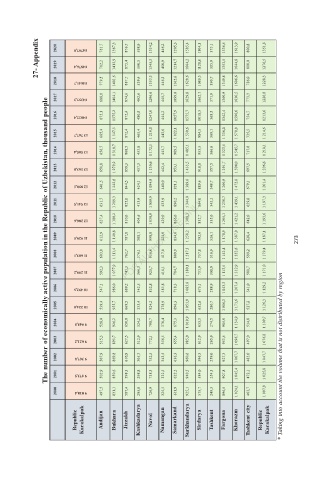
27- Appendix    2020   2019   14797,9   14876,4   781,7   782,2   1387,3  1413,9   876,7   875,4   598,9   590,3   1334,2   1345,3   446,2   450,9   1205,3  1214,7   1585,4  1604,2   1104,1   1128,8   375,1   385,9   1336,5  1353,5   1613,9  1644,8   800,8   810,0   1351,8   1276,5


                2018    14641,7   779,5   1401,6   887,7   539,4   1353,3   446,3   1162,6   1620,6   1089,3   390,7   1349,8   1606,6   786,0   1228,3

                2017    14357,3   688,8   1404,1   874,6   492,6   1296,6   445,7   1099,0   1629,8   1062,7   371,9   1360,9   1630,5   773,3   1226,8
             The number  of economically active population in the Republic of Uzbekistan, thousand people
                2016    14022,4   675,1   1375,2   872,4   480,8   1247,0   444,2   1057,9   1575,7   1018,3   368,5   1342,4   1596,6   754,7   1213,6

                2015    13 767,7   665,4   1 347,3   872,4   465,4   1 210,0   443,6   1 022,1   1 530,6   984,5   369,1   1 336,0   1 570,9   735,5   1 214,6

                2014    13 505,4   656,7   1 318,7   868,5   453,0   1 172,5   443,7   989,5   1 485,1   953,5   366,6   1 323,5   1 545,7   717,8   1 210,1
                2013    13 163,0   650,8   1 279,2   859,3   437,3   1 130,6   442,4   953,1   1 433,5   918,8   357,5   1 291,7   1 504,0   697,5   1 206,6

                2012    12 850,1   641,5   1 242,6   844,5   424,1   1 094,9   440,0   921,1   1 389,0   889,6   348,7   1 260,9   1 472,0   679,1   1 201,4

                2011    12 541,5   631,7   1 209,3   825,0   413,9   1 059,9   433,9   890,2   1 344,0   864,0   342,1   1 230,7   1 439,1   659,8   1 197,3

                2010    12 286,6   627,4   1 180,2   810,0   404,6   1 030,9   429,0   866,0   1 308,3   832,7   335,0   1 205,1   1 421,2   642,0   1 193,6

                2009    11 929,5   612,9   1 140,8   787,8   388,1   990,8   424,0   834,0   1 258,2   792,0   326,1   1 178,9   1 387,9   620,4   1 187,1   273
                2008    11 603,1   603,0   1 111,4   762,7   376,1   956,6   417,0   809,9   1 217,3   757,8   316,9   1 142,4   1 352,6   599,2   1 179,4

                2007    11 299,2   592,3   1 077,9   741,3   366,3   925,7   410,1   784,7   1 180,1   731,9   308,9   1 113,5   1 312,9   581,7   1 171,0

                2006    10 492,5   547,1   986,0   689,2   342,5   852,8   385,8   718,3   1 085,0   675,1   288,9   1 043,3   1 207,4   541,0   1 129,2

                2005    10 224,0   539,4   955,7   669,5   333,4   824,2   378,9   696,3   1 051,9   652,6   280,7   1 016,3   1 171,6   527,2   1 126,3

                2004    9 945,5   528,0   926,2   650,0   324,2   798,7   370,4   675,3   1 019,9   633,3   274,5   985,6   1 134,9   514,8   1 109,7
                2003    9 621,2   515,3   893,7   627,5   312,9   772,1   356,5   655,4   985,0   612,9   265,9   953,5   1 096,7   497,0   1 076,8

                2002    9 367,8   507,9   869,8   610,9   305,3   752,5   343,5   636,3   960,6   596,3   259,0   927,3   1 067,7   483,0   1 047,7   * Taking into account the volume that is not distributed by region

                2001    9 173,5   502,9   850,6   598,3   298,8   738,3   332,5   622,2   940,5   584,0   254,3   907,8   1 045,4   472,1   1 025,8

                2000    9 018,4   497,5   831,1   587,4   295,8   726,9   325,5   611,9   925,1   575,7   249,3   896,5   1 024,1   463,7   1 007,9


                     Republic   Karakalpak   Andijan   Bukhara   Jizzakh   Kashkadarya   Navoi   Namangan   Samarkand   Surkhandarya   Sirdarya   Tashkent   Fargona   Khorazm   Tashkent city   Republic   Karakalpak