
Page 274 - Theoretical and Practical Interpretation of Investment Attractiveness
P. 274
2020 33905,2 1898,3 3127,7 1923,9 1382,1 3280,4 997,1 2810,8 3877,4 2629,1 846,3 2941,9 3752 1866,5 2571,7
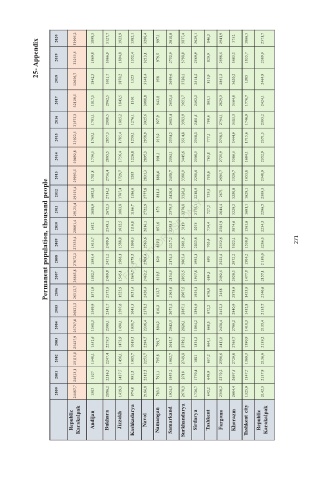
25- Appendix
2019 33255,5 1869,8 3066,9 1894,8 1352,4 3213,1 979,5 2752,9 3798,9 2569,9 829,9 2898,5 3683,3 1835,7 2509,9
2018 32656,7 1842,3 3011,7 1870,2 1325 3148,4 958 2699,6 3720,1 2514,2 815,9 2861,2 3620,2 1805 2464,9
2017 32120,5 1817,5 2962,5 1843,5 1301 3088,8 942,8 2652,4 3651,7 2462,3 803,1 2829,3 3564,8 1776,7 2424,1
2016 31575,3 1791,1 2910,5 1815,2 1276,1 3025,6 927,9 2603,4 3583,9 2411,5 790,6 2794,1 3505,3 1746,9 2393,2
2015 31022,5 1763,1 2857,3 1785,4 1250,1 2958,9 913,2 2554,2 3514,8 2358,3 777,1 2758,3 3444,9 1715,6 2371,3
2014 30492,8 1736,5 2805,5 1756,4 1226,8 2895,3 901,1 2504,1 3445,6 2308,3 763,8 2725,9 3386,5 1684,1 2352,9
2013 2012 29993,5 29555,4 1711,8 1692,8 2756,4 2714,2 1729,7 1707,4 1205 1186,6 2831,3 2777,8 888,4 881,2 2458,7 2420,6 3380,9 3326,2 2260,6 2218,9 750,6 739,5 2695,7 2671 3329,7 3280,8 1653,8 1629,1 2340,9 2309,3
Permanent population, thousand people 2011 2010 2009 2008 29123,4 28001,4 27533,4 27072,2 1680,9 1632 1615,7 1595,4 2672,3 2549,1 2499,9 2451,2 1683,8 1612,5 1588,8 1566,1 1166,7 1116,8 1098,3 1079,5 2722,9 2616,1 2563,6 2509,4 873 851,6 839,3 829 2379,5 2258,5 2217,2 217
2005 2007 2006 26663,8 26312,7 26021,3 1582,7 1571,9 1569,9 2409,8 2375,9 2342,7 1545,1 1525,9 1507,6 1064,7 1051,4 1043,3 2462,2 2420,4 2378,5 819,5 812,7 810,2 2134,5 2103,6 2073,2 2955,5 2907,5 2867,1 1957,8 1925,1 1894,9 684,3 676,9 672,2 2492,5 2468 2452,3
2004 25707,4 1560,3 2309,1 1490,1 1030,7 2336,4 804,2 2042,5 2826,1 1864,2 668,5 2430,4 2799,2 1410,3 2135,4
2003 25427,9 1551,6 2279,7 1473,9 1019,5 2294,7 799,7 2013,7 2789,1 1834,3 664,1 2411,8 2765,7 1390,9 2139,2
2002 25115,8 1540,1 2247,4 1456,1 1005,7 2253,7 795,8 1982,7 2749,8 1801 657,2 2390,6 2729,8 1369,3 2136,6
2001 24813,1 1527 2216,5 1437,7 991,5 2212,5 791,1 1953,2 2710 1770,4 649,9 2370,2 2697,5 1347,7 2137,9
2000 24487,7 1503 2186,2 1419,3 974,8 2166,8 783,3 1924,3 2670,3 1736,7 642,2 2350,2 2664,4 1323,9 2142,3
Republic Karakalpak Andijan Bukhara Jizzakh Kashkadarya Navoi Namangan Samarkand Surkhandarya Sirdarya Tashkent Fargona Khorazm Tashkent city Republic Karakalpak