
Page 270 - Theoretical and Practical Interpretation of Investment Attractiveness
P. 270
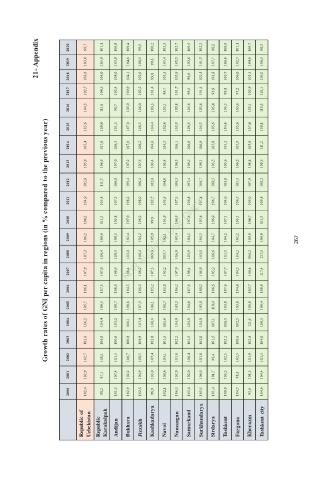
21- Appendix     2020   2019   99,7   103,8   101,1   105,9   100,8   103,9   100,4   104,6   99,5   106,5   100,2   99,6   105,3   103,4   102,7   105,5   100,5   103,6   102,2   101,5   98,2   107,7   100,9   106,0   101,1   102,7   100,7   104,0   98,3   106,5


             Growth rates of GNI per capita in regions (in % compared to the previous year)
                   2017   2018   103,6   102,7   104,0   104,5   108,0   102,4   104,1   100,9   102,0   102,2   99,8   101,4   102,5   99,7   102,6   101,7   98,6   99,5   102,5   101,4   101,8   93,9   105,7   99,8   106,0   97,2   101,5   102,9   110,0   110,1

                   2016   104,3   111,6   98,7   105,0   106,0   103,3   102,1   105,8   105,6   103,6   105,4   103,5   103,6   103,1   110,3

                   2015   105,6   109,4   101,5   107,0   106,5   104,4   102,4   105,9   106,5   105,3   105,6   104,8   105,6   107,4   109,1

                   2014   105,4   107,8   106,3   107,0   106,2   104,6   104,3   106,1   106,6   106,0   105,0   105,2   105,9   105,9   111,2

                   2013   105,9   106,9   107,0   107,2   107,5   103,4   103,4   106,5   106,5   106,1   103,5   105,6   106,2   108,4   108,5

                   2012   105,8   111,7   106,8   106,4   106,4   102,8   104,0   106,3   107,4   106,7   108,5   103,8   105,3   107,9   108,2

                   2011   104,9   105,8   107,3   108,2   108,0   102,7   105,5   107,3   106,8   107,8   106,7   104,0   106,7   105,0   109,8

                   2010   104,3   111,2   105,8   107,0   106,2   99,9   101,9   106,9   107,5   107,6   106,9   107,1   103,3   104,7   111,3

                   2009   106,2   106,6   108,5   102,4   104,2   105,9   102,1   105,4   104,5   104,3   104,7   104,2   102,2   105,0   106,8
                                                                                 267
                   2008   107,3   106,4   109,3   103,0   106,4   109,0   103,7   106,9   105,9   103,1   106,6   101,5   104,2   104,2   117,3

                   2007   107,9   107,0   108,9   108,4   106,2   107,3   103,2   107,9   109,4   105,9   103,2   107,7   104,5   104,4   117,4

                   2006   106,1   107,3   108,5   104,3   106,5   105,2   105,0   106,2   107,5   108,2   106,5   107,6   104,9   105,7   108,9

                   2005   105,7   106,5   108,7   108,6   107,3   106,1   101,7   105,5   104,6   103,8   110,4   103,0   105,0   101,8   106,4

                   2004   106,2   104,4   103,2   106,1   107,4   100,6   105,6   104,9   104,0   104,0   107,1   108,5   102,5   111,6   106,3
                   2003   103,0   106,8   100,6   100,8   108,9   103,8   101,3   102,2   105,5   102,0   101,5   102,2   100,6   102,4   104,0

                   2002   102,7   100,1   101,5   100,7   108,5   107,4   104,1   101,6   106,4   101,8   96,4   102,5   103,5   101,9   101,5

                   2001   102,9   97,1   107,4   102,2   104,9   103,0   100,6   102,9   102,0   106,0   101,7   103,3   98,3   101,3   104,4

                   2000   102,4   88,2   101,3   102,9   102,5   96,9   102,1   106,3   103,0   103,5   101,4   109,9   104,7   93,0   104,6

                       Republic of   Uzbekistan   Republic   Karakalpak   Andijan   Bukhara   Jizzakh   Kashkadarya   Namangan   Samarkand   Surkhandarya   Sirdarya   Tashkent   Fargona   Khorazm   Tashkent city


                                            Navoi