
Page 265 - Theoretical and Practical Interpretation of Investment Attractiveness
P. 265
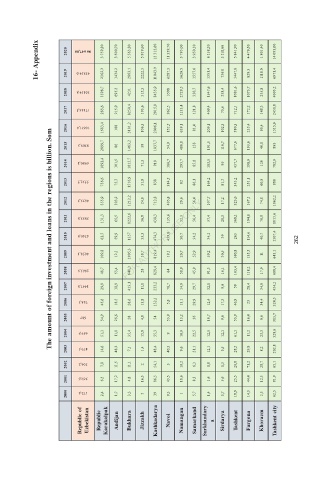
16- Appendix   2020   2019   43854.0   86 647,00   3 759,80   2362.2   3 500,70   1434.2   5 563,80  2863.1   5 919,60  2222.3   13 313,60   11043.9   11 359,70   6287.3   3 795,00  3629.5   3 950,10   1557.6   6 158,20  1351.4   3 110,60   736.0   5 841,90  1447.8   4 479,50   829.3   1 801,40  1118.0   14 093,00  6971.4


               The amount of foreign investment and loans in the regions is billion. Som

                  2018   30154,8   1598,7   695,3   4231   315,3   8435,9   3598   2729,5   330,7   1547,6   258,4   1081,6   1073,7   255,8   4003,2

                  2017   17146,5   283,6   215,9   8250,4   193,6   2015,9   962,5   1133,4   121,8   409,4   75,6   712,1   172,2   148,3   2451,8

                  2016   10611,4   1683,4   108   3101,2   106,3   2006,1   152,5   639,1   81,4   209,1   102,3   580,3   235,4   90,4   1515,9

                  2015   8309,5   2899,7   86   1463,2   38   1037,7   54,9   488,8   128   191,5   116,7   677,6   193,6   40,8   893

                  2014   6980,1   1892,4   101,5   1615,7   71,3   919   180,7   295,7   85,8   183,5   95   437,7   198,9   120   782,9

                  2013   5532,7   736,6   75,7   1516,9   31,9   838   384,5   82   86,1   164,2   81,7   343,2   251,1   60,8   880

                  2012   4653,3   355,9   103,2   1212,2   24,8   712,8   405,8   29,6   56,4   107,7   17,2   323,6   167,1   74,8   1062,2

                  2011   3853,8   131,3   65,5   1222,6   36,8   438,3   135,6   32,3   56,4   57,4   28,3   368,1   194,8   70,8   1015,6

                  2010   4340,8   62,7   59,9   1357   33,3   474,3   439,8   30,7   34,2   34,1   39   263   114,6   40,7   1307,4      262
                  2009   4058,1   109,8   12,1   1905,3   18,7   819,4   19,1   20,7   52,9   59,2   30,5   160,8   135,5   11   643,1

                  2008   2863,9   48,7   53,4   640,3   28   829,4   64   58,9   45,9   91,3   16,1   163,4   118,2   17,9   688,4

                  2007   1447,8   29,9   18,9   413,1   11,1   233,2   78,7   14,9   29,7   32,1   9,6   59   28,4   34,9   454,2
                  2006   748,3   45,6   18,5   28,6   13,8   132,1   5,8   13,1   29,9   12,4   17,3   46,9   23   34,4   324,5

                  2005   687   34,9   25,6   28   4,8   54   53,9   13,2   36   10,7   9,6   55,9   16,4   9,6   313,7
                  2004   659,9   51,1   11,1   35,4   15,8   55,3   9   10,9   22,5   12,5   12,1   61,1   11,2   23,3   328,6

                  2003   479,5   14,6   48,2   7,1   1,4   48,4   40,3   9,6   21,1   12,1   5,5   28,5   29,9   8,2   202,8
                  2002   306,2   7,8   11,5   11,1   2   54,1   3   10,2   6,3   0,8   1,3   26,8   71,2   28,7   65,1

                  2001   369,6   6,3   17,2   4,8   16,3   86,5   43,5   10,6   8,3   1,6   5,6   25,5   44,4   12,3   81,9
                  2000   172,4   2,4   1,7   3,3   5   39   9,3   1   5,7   1,4   3,7   18,9   14,3   2,5   62,5


                      Republic of   Uzbekistan   Republic   Karakalpak   Andijan   Bukhara   Jizzakh   Kashkadarya   Navoi   Namangan   Samarkand   Surkhandary  a   Sirdarya   Tashkent   Fargona   Khorazm   Tashkent city