
Page 263 - Theoretical and Practical Interpretation of Investment Attractiveness
P. 263
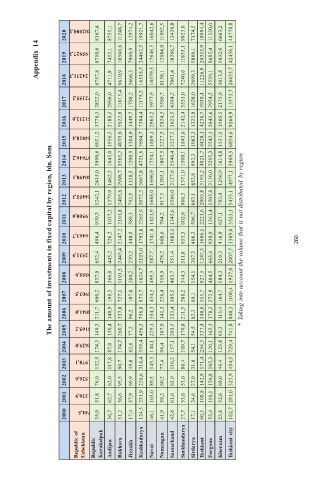
Appendix  14       2020   2019   202000,1  195927,3  124231,3  8167,4   8750,6   6757,8   8755,1   7452,1   4711,9   11248,7  10366,6   9610,9   12974,2   7900,9   3606,3   19921,7  24462,5  16518,5   16042,6  17646,3  10579,5   11982,5  12084,9   8158,1   13426,0  10266,7   7061,4   9923,0  11835,1   7240,6   7174,5   5869,1


                  2017   2018   72155,2   2822,0   2986,0   11613,4   1788,2   11175,3   3977,9   3586,7   4384,2   3551,0   1628,0   5938,4   2954,5   2175,9   13573,7
              The amount of investments in fixed capital by region, bln. Som
                  2016   51232,0   3778,3   2188,5   5922,9   1449,7   7304,4   2963,2   2824,5   3623,5   2142,4   1322,9   4238,7   2643,6   1560,5   9268,9


                  2015   44810,4   6021,2   1956,5   4075,9   1304,9   5894,7   1809,1   2227,5   3237,2   1843,6   1083,3   4428,1   2542,3   1531,5   6854,6

                  2014   37646,2   3990,6   1645,0   3583,2   1200,9   4721,8   1754,1   1807,5   2540,4   1509,1   992,3   4021,7   2295,3   1614,8   5969,5

                  2013   30490,1   2415,0   1462,3   2998,7   1128,5   3667,8   1696,9   1205,1   2127,6   1371,0   852,8   3195,2   2130,0   1256,9   4977,1

                  2012   24455,3   1242,1   1379,9   2405,8   792,5   3072,2   1688,0   917,3   1586,0   980,3   663,1   2005,8   1505,8   783,4   5433,1

                  2011   19500,0   950,3   1037,2   2101,8   580,3   2265,9   1421,9   764,2   1345,6   802,9   596,7   2221,6   1261,4   627,1   3523,1


                  2010   16463,7   496,4   726,2   2147,2   440,8   1792,8   1741,8   660,6   1083,1   655,3   406,2   1606,1   930,9   416,9   3309,0  * Taking into account the volume that is not distributed  by region   260

                  2009   12531,9   652,4   445,2   2443,4   230,2   2193,0   587,7   478,2   551,4   511,8   207,3   1247,3   663,4   219,3   2007,7

                  2008   9555,9   837,9   366,0   1191,5   200,2   1824,7   499,3   310,9   403,7   344,3   154,1   827,5   484,5   184,3   1927,0

                  2007   5903,5   600,2   198,3   727,1   107,0   873,7   434,3   226,4   305,5   288,2   89,1   515,7   272,9   164,7   1100,4

                  2006   4041,0   211,7   140,9   337,8   96,2   756,8   354,3   141,3   233,4   211,5   82,3   340,6   178,2   113,4   840,3
                  2005   3165,2   149,3   130,4   260,7   77,2   456,5   229,1   107,9   203,5   170,8   54,5   337,4   162,3   63,3   741,8

                  2004   2629,0   174,3   87,0   174,7   62,6   339,4   144,1   96,4   157,1   109,7   54,1   256,3   120,1   123,8   729,4

                  2003   1978,1   132,5   117,8   90,7   49,0   316,4   145,3   77,4   110,2   86,4   31,8   171,4   105,3   46,4   494,5

                  2002   1526,6   76,0   62,0   95,5   69,9   226,6   89,5   60,2   63,9   53,0   27,9   142,9   156,8   69,0   323,9
                  2001   1320,9   51,8   62,7   56,6   57,9   231,9   103,0   59,2   61,6   53,6   24,6   108,8   110,1   52,6   281,0

                  2000   744,5   35,9   36,7   31,2   17,4   124,3   46,1   41,9   42,6   27,7   17,1   60,5   52,4   25,8   182,7


                     Republic of   Uzbekistan   Republic   Karakalpak   Andijan   Bukhara   Jizzakh   Kashkadarya   Navoi   Namangan   Samarkand   Surkhandarya   Sirdarya   Tashkent   Fargona   Khorazm   Tashkent city