
Page 266 - Theoretical and Practical Interpretation of Investment Attractiveness
P. 266
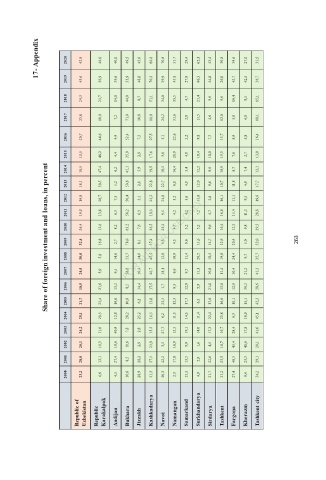
17- Appendix                   2020   42,9   46,0   40,0   49,5   45,6   66,8   70,8   31,7   29,4   62,1   43,4   30,8   39,6   27,0   31,5


                Share of foreign investment and loans, in percent
                  2018   2019   43,6   24,3   36,9   23,7   39,6   14,8   53,9   44,0   48,8   8,7   70,3   51,1   39,9   34,0   45,8   33,5   27,8   4,7   66,3   21,4   44,8   9,6   26,0   9,6   42,7   19,4   42,5   8,5   36,7   15,1

                  2017   23,8   10,0   7,2   71,0   10,8   18,0   24,2   31,6   2,8   11,5   4,6   12,0   5,8   6,8   18,1

                  2016   20,7   44,6   4,9   52,4   7,3   27,5   5,1   22,6   2,2   9,8   7,7   13,7   8,9   5,8   16,4

                  2015   18,5   48,2   4,4   35,9   2,9   17,6   3,0   21,9   4,0   10,4   10,8   15,3   7,6   2,7   13,0

                  2014   18,5   47,4   6,2   45,1   5,9   19,5   10,3   16,4   3,4   12,2   9,6   10,9   8,7   7,4   13,1
                  2013   18,1   30,5   5,2   50,6   2,8   22,8   22,7   6,8   4,0   12,0   9,6   10,7   11,8   4,8   17,7
                  2012   19,0   28,7   7,5   50,4   3,1   23,2   24,0   3,2   3,6   11,0   2,6   16,1   11,1   9,5   19,6

                  2011   19,8   13,8   6,3   58,2   6,3   19,3   9,5   4,2   4,2   7,2   4,7   16,6   15,4   11,3   28,8
                  2010   26,4   12,6   8,2   63,2   7,6   26,5   25,2   4,7   3,2   5,2   9,6   16,4   12,3   9,8   39,5
                  2009   32,4   16,8   2,7   78,0   8,1   37,4   3,3   4,3   9,6   11,6   14,7   12,9   20,4   5,0   32,0
                                                                               263
                  2008   30,0   5,8   14,6   53,7   14,0   45,5   12,8   18,9   11,4   26,5   10,4   19,8   24,4   9,7   35,7
                  2007   24,5   5,0   9,5   56,8   10,4   26,7   18,1   6,6   9,7   11,1   10,8   11,4   10,4   21,2   41,3

                  2006   18,5   21,6   13,2   8,5   14,4   17,5   1,7   9,3   12,8   5,9   21,0   13,8   12,9   30,3   38,6
                  2005   21,7   23,4   19,6   10,8   6,2   11,8   23,5   12,3   17,7   6,3   17,6   16,6   10,1   15,1   42,3
                  2004   25,1   29,3   12,8   20,2   25,2   16,3   6,2   11,3   14,3   11,4   22,4   23,8   9,3   18,9   45,1

                  2003   24,2   11,0   40,9   7,8   2,8   15,3   27,7   12,5   19,1   14,0   17,3   16,7   28,4   17,8   41,0
                  2002   20,1   10,3   18,6   11,6   2,9   23,9   3,3   16,9   9,9   1,6   4,5   18,7   45,4   41,6   20,1

                  2001   28,0   12,1   27,4   8,5   28,2   37,3   42,2   17,8   13,5   2,9   22,6   23,5   40,3   23,3   29,1
                  2000   23,2   6,6   4,5   10,6   28,9   31,3   20,3   2,3   13,3   4,9   21,7   31,2   27,4   9,6   34,2


                     Republic of   Uzbekistan   Republic   Karakalpak   Andijan   Bukhara   Jizzakh   Kashkadarya   Namangan   Samarkand   Surkhandarya   Sirdarya   Tashkent   Fargona   Khorazm   Tashkent city


                                            Navoi