
Page 271 - Theoretical and Practical Interpretation of Investment Attractiveness
P. 271
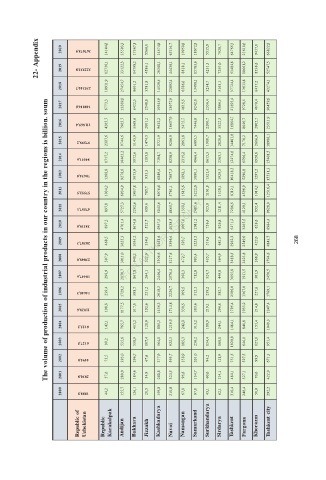
22- Appendix   2020   2019   2018   367078,9   322535,8   235340,7   14144,8  12736,1  10911,9   35593,3   33122,3   27454,7   17567,1  14798,2  8601,2   5560,0  4586,1  3581,8   14574,8  20360,1  14529,5   65116,7  44438,1  22892,4   10950,8  8818,1  6586,6   18072,8  15783,6  13488,1   5515,9   4231,3


             The volume of production of industrial products in our country in the regions is billion. soum

                 2016   2017   148816,0   111869,4   6773,3  4265,7   13269,8   7965,7   6422,3  5569,6   2548,8  2001,2   10945,9  9632,2   13072,9  10657,9   4615,5  3475,7   9242,0  7446,0   2356,4   2200,7   3806,5   3522,3   21693,4  16864,7   9728,5  8040,7   4070,4   2802,7   30459,6  23511,9

                 2015   97598,2   2387,6   9744,6   5143,9   1474,5   8721,9   9286,9   2861,8   6095,5   1910,7   2820,6   14401,0   7170,2   2616,0   18986,1

                 2014   84011,6   1717,2   10463,2   3972,6   1195,8   7194,7   8238,9   2315,2   4966,4   1615,3   2363,1   12474,6   6596,4   1920,8   15468,5

                 2013   70634,8   1368,8   9278,6   3073,9   933,3   6849,4   7087,3   1892,1   3880,1   1321,4   1929,3   10418,3   5290,8   1297,2   15531,3
                 2012   57552,5   1034,2   6934,9   2457,8   785,7   6076,4   5761,1   1615,6   3222,0   1101,8   1528,1   8112,1   4596,9   1014,2   12516,4

                 2011   47587,1   897,8   5727,3   2202,6   659,6   5043,6   4865,7   1358,1   2485,6   925,8   1211,4   7286,5   4120,1   852,4   9628,9

                 2010   38119,0   697,2   4701,4   1674,8   522,7   4957,5   4038,5   1007,0   2011,2   756,4   926,8   5471,2   3265,5   628,6   6984,4
                 2009   28387,3   468,5   3625,3   1095,2   334,3   4461,6   3396,6   593,7   1223,5   516,3   681,9   3962,2   2549,0   422,0   4843,7   268

                 2008   23848,0   397,9   3011,0   940,2   322,0   3306,6   3217,6   472,7   985,4   435,7   564,9   3488,5   2423,8   368,9   3794,6

                 2007   18447,6   298,9   2170,7   867,8   264,1   2446,4   2570,4   368,3   712,0   324,7   449,8   3155,8   1911,5   301,9   2450,5
                 2006   14640,3   239,4   1729,2   598,7   221,2   2018,2   2226,7   309,5   512,1   259,2   382,7   2506,0   1367,0   257,6   1769,1

                 2005   11028,6   198,8   1177,5   517,0   192,6   1436,3   1714,8   330,5   383,6   219,1   296,6   1795,4   1033,2   214,8   1247,4

                 2004   8123,2   142,1   765,7   451,2   128,9   805,3   1219,5   242,8   313,2   188,9   244,1   1484,1   840,8   151,4   1049,3

                 2003   6127,5   99,2   535,6   358,9   107,4   564,1   922,3   185,3   250,2   134,4   168,1   1020,9   646,1   127,1   951,4
                 2002   4494,0   73,5   393,0   296,7   67,6   377,9   593,7   138,9   201,0   94,2   111,9   751,5   527,5   99,9   671,3

                 2001   2830,8   57,6   280,0   184,6   34,9   240,8   324,5   96,6   134,7   60,0   114,1   484,1   327,1   70,0   422,0

                 2000   1888,9   44,2   155,7   126,1   20,5   159,8   210,8   67,8   97,8   43,1   62,1   310,4   248,4   50,0   292,2

                      Republic of   Uzbekistan   Republic   Karakalpak   Andijan   Bukhara   Jizzakh   Navoi   Namangan   Samarkand   Sirdarya   Tashkent   Fargona   Khorazm
                                           Kashkadarya   Surkhandarya   Tashkent city